PATTERNS
RGB composites
additive color system
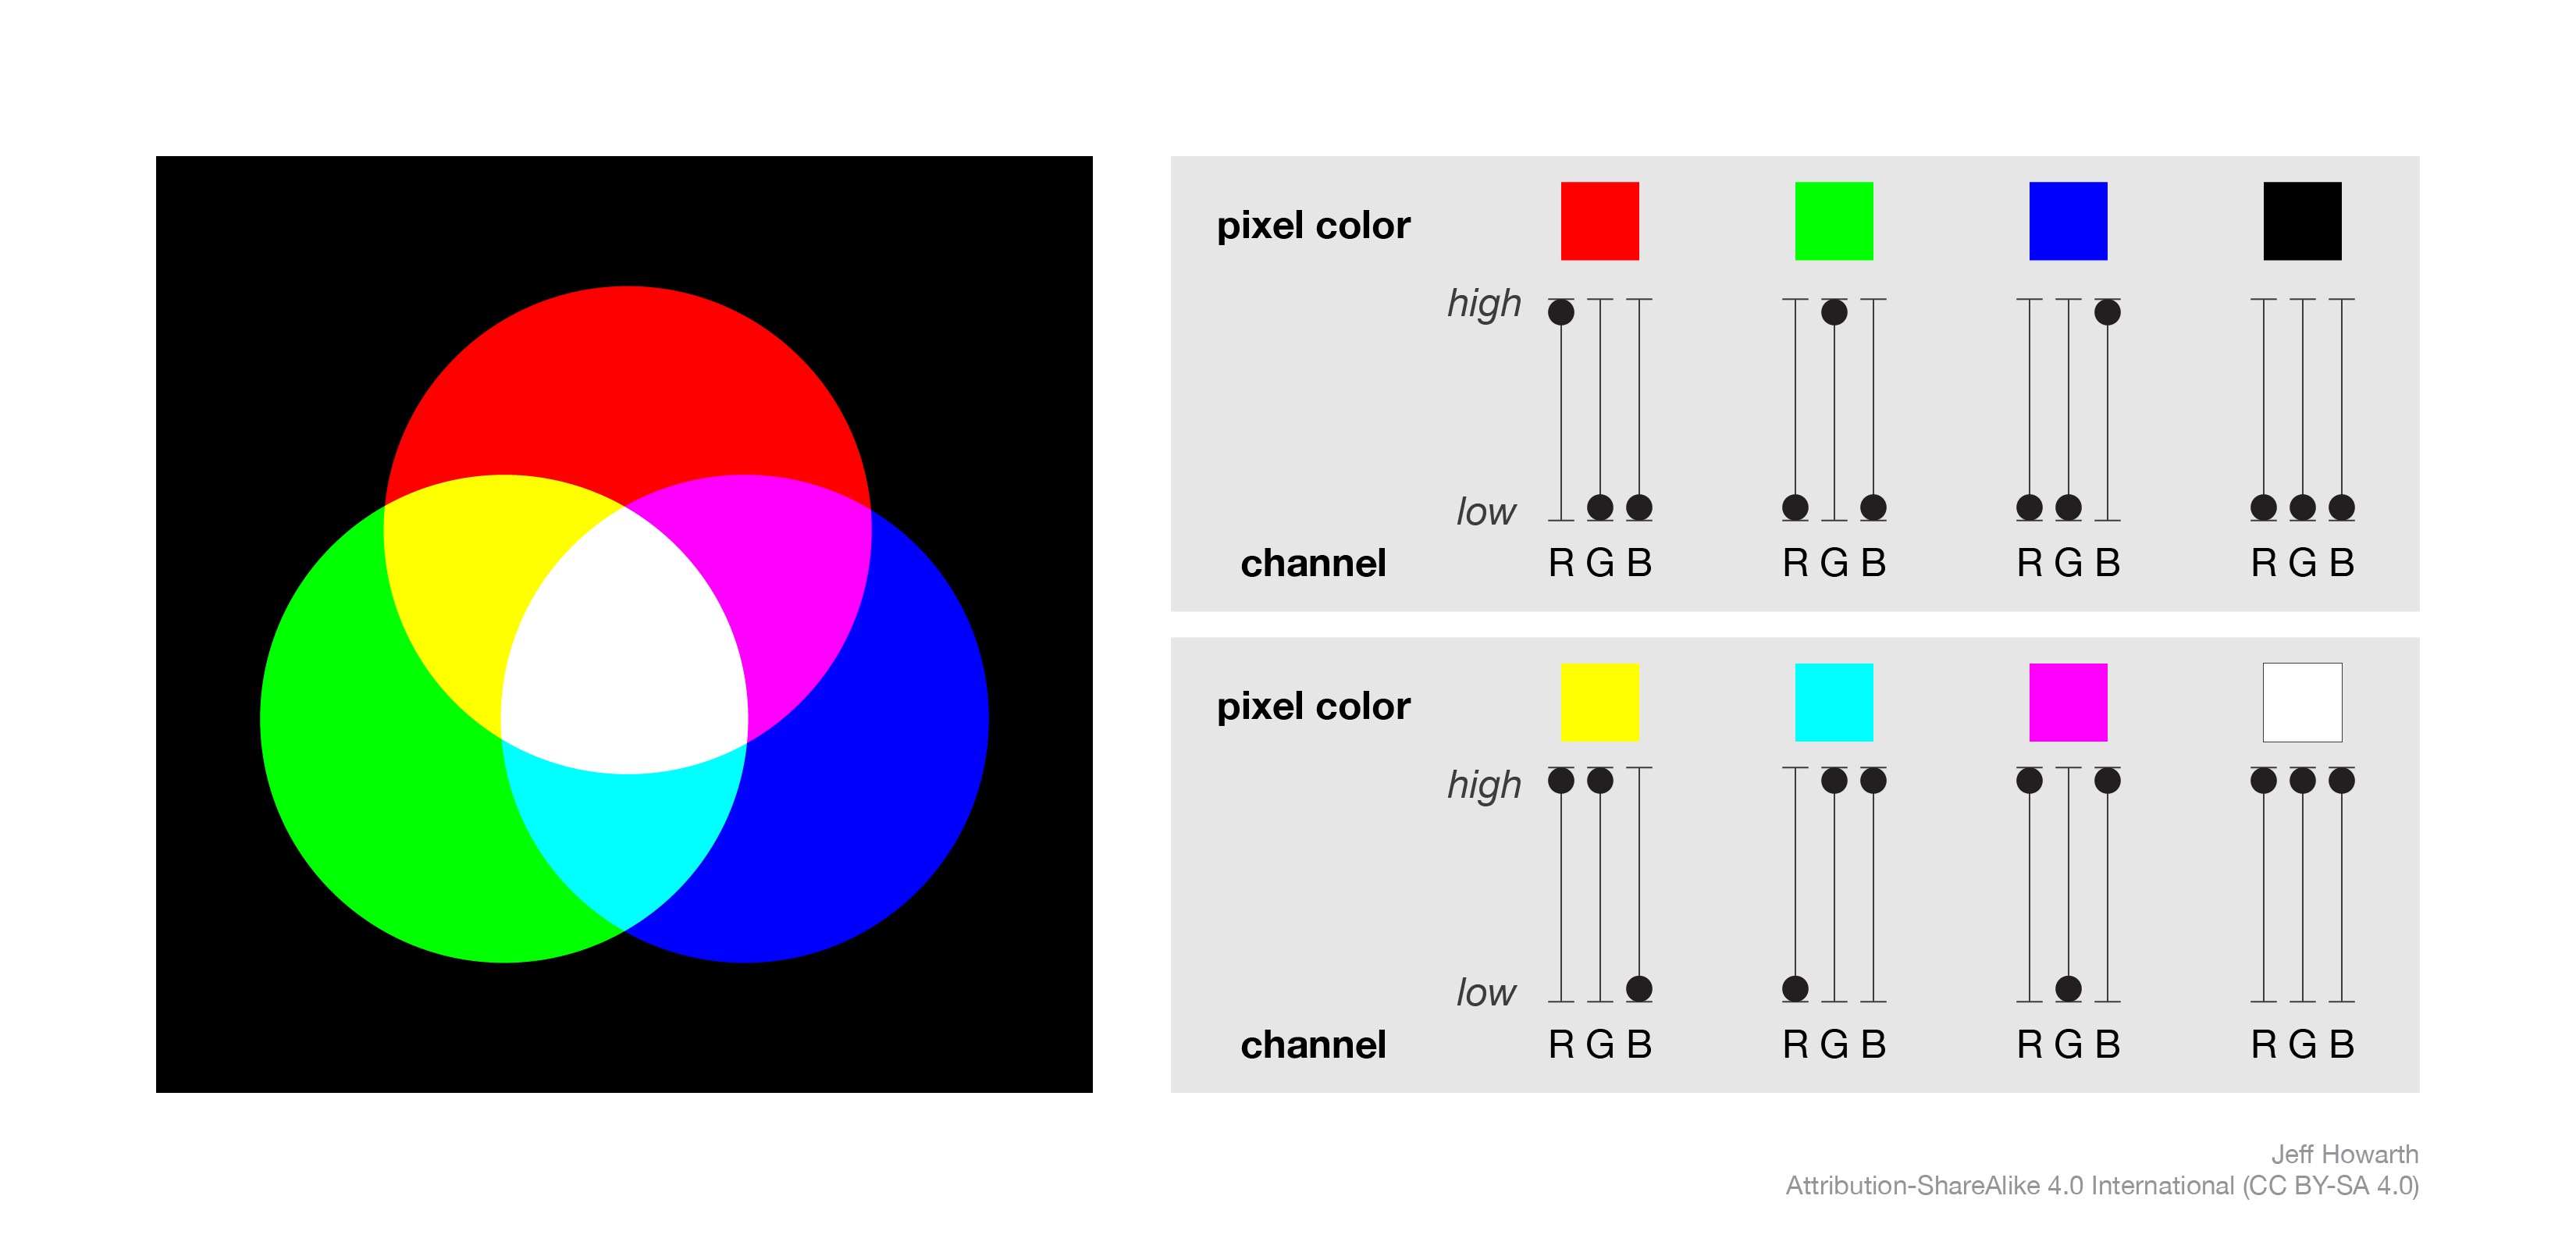
RGB composites use additive color to display raster data values in three bands at once.
More soon.
Use the RGB mixer below to create the colors by adding values in Red, Green, and Blue channels.
Open app in new browser window
Here is the key for primary and secondary additive colors.

RGB viz
This is a basic pattern to visualize multi-band images as a combination of red, green, and blue channels.
var rgb_viz =
    {
        bands:  ['red', 'green', 'blue'],
        min:    [0, 0, 0],
        max: [255, 255, 255],
        gamma: [1,1,1]
    }
;
The gamma property bends the function that maps display values to data values in order to lighten or darken the midtones of the image. Lowering the gamma value (towards 0) darkens the image, while raising the gamma value (towards 2) lightens the image.
The min, max, and gamma values can be adjusted separately for each band.
natural and false color
A natural color image displays reflectance in the Red, Green, and Blue bands of the EM spectrum using the Red, Green, and Blue color channels, respectively. The result looks roughly similar to what we see when we have a window seat and the shade up.
A false color image breaks this like-to-like mapping of the EM spectrum to additive color. For example, the near infrared (NIR) false color image displays reflectance in NIR, Red, and Green bands of the EM spectrum to the Red, Green, and Blue color channels. respectively. The result looks different from our experience, but is often helpful for distinguishing different types of vegetation and surfaces that otherwise look ‘green’ in natural color composites.
Importantly, a NIR false color image is just one example of a false color image. Many other false color images display reflectance in shortwave infrared (SWIR), sometimes called mid-range infrared, that are useful in wide range of applications.
To better understand how false color images work, please read:
This is an old but still helpful reference for exploring different band combinations for false color:
chart spectral signatures
To interpret and explain why false color images look the way they do, it can be helpful to chart the spectral signature of locations in an image.
If you add the appropriate pattern below to the end of a script that produces an image from a Landsat collection, you should be able to click on locations on the Map and chart the spectral signature of each location.
 Landsat 5
// -------------------------------------------------------------
//  Click to chart spectral signatures from L5 image.
// -------------------------------------------------------------

var config = {};
var panel_chart = ui.Panel({style: {position: 'bottom-left'}});
var samples = [];

Map.onClick(function(coords) {          // To embed in app, change "Map" to "left_Map" or "right_Map".

  config.poi = ee.Geometry.Point(coords.lon, coords.lat);
  samples.push(ee.Feature(config.poi, {'sample': samples.length}));

  panel_chart.clear();
  panel_chart.add(geo.icLandsat.chartSpectralSignatureL5(
    output,                             // Name of L5 image ('output' assumes you are using starter script).
    samples
    ));
  }
);

Map.add(panel_chart);                   // To embed in app, change "Map" to "side_bar".
 Landsat 7
// -------------------------------------------------------------
//  Click to chart spectral signatures from L7 image.
// -------------------------------------------------------------

var config = {};
var panel_chart = ui.Panel({style: {position: 'bottom-left'}});
var samples = [];

Map.onClick(function(coords) {          // To embed in app, change "Map" to "left_Map" or "right_Map".

  config.poi = ee.Geometry.Point(coords.lon, coords.lat);
  samples.push(ee.Feature(config.poi, {'sample': samples.length}));

  panel_chart.clear();
  panel_chart.add(geo.icLandsat.chartSpectralSignatureL7(
    output,                             // Name of L7 image ('output' assumes you are using starter script).
    samples
    ));
  }
);

Map.add(panel_chart);                   // To embed in app, change "Map" to "side_bar".
 Landsat 8
// -------------------------------------------------------------
//  Click to chart spectral signatures from L8 image.
// -------------------------------------------------------------

var config = {};
var panel_chart = ui.Panel({style: {position: 'bottom-left'}});
var samples = [];

Map.onClick(function(coords) {          // To embed in app, change "Map" to "left_Map" or "right_Map".

  config.poi = ee.Geometry.Point(coords.lon, coords.lat);
  samples.push(ee.Feature(config.poi, {'sample': samples.length}));

  panel_chart.clear();
  panel_chart.add(geo.icLandsat.chartSpectralSignatureL8(
    output,                             // Name of L8 image ('output' assumes you are using starter script).
    samples
    ));
  }
);

Map.add(panel_chart);                   // To embed in app, change "Map" to "side_bar".
 Landsat 9
// -------------------------------------------------------------
//  Click to chart spectral signatures from L9 image.
// -------------------------------------------------------------

var config = {};
var panel_chart = ui.Panel({style: {position: 'bottom-left'}});
var samples = [];

Map.onClick(function(coords) {          // To embed in app, change "Map" to "left_Map" or "right_Map".

  config.poi = ee.Geometry.Point(coords.lon, coords.lat);
  samples.push(ee.Feature(config.poi, {'sample': samples.length}));

  panel_chart.clear();
  panel_chart.add(geo.icLandsat.chartSpectralSignatureL9(
    output,                             // Name of the L9 image ('output' assumes you are using starter script).
    samples
    ));
  }
);

Map.add(panel_chart);                   // To embed in app, change "Map" to "side_bar".
 MODIS
MODIS
// -------------------------------------------------------------
//  Click to chart spectral signatures from MODIS image.
// -------------------------------------------------------------

var config = {};
var panel_chart = ui.Panel({style: {position: 'bottom-left'}});
var samples = [];

Map.onClick(function(coords) {          // To embed in app, change "Map" to "left_Map" or "right_Map".

  config.poi = ee.Geometry.Point(coords.lon, coords.lat);
  samples.push(ee.Feature(config.poi, {'sample': samples.length}));

  panel_chart.clear();
  panel_chart.add(geo.icMODIS.chartSpectralSignatureMODIS(
    output,                             // Name of the MODIS image ('output' assumes you are using starter script).
    samples
    ));
  }
);

Map.add(panel_chart);                   // To embed in app, change "Map" to "side_bar".
 Sentinel 2
// -------------------------------------------------------------
//  Click to chart spectral signatures from S2 image.
// -------------------------------------------------------------

var config = {};
var panel_chart = ui.Panel({style: {position: 'bottom-left'}});
var samples = [];

Map.onClick(function(coords) {          // To embed in app, change "Map" to "left_Map" or "right_Map".

  config.poi = ee.Geometry.Point(coords.lon, coords.lat);
  samples.push(ee.Feature(config.poi, {'sample': samples.length}));

  panel_chart.clear();
  panel_chart.add(geo.icSentinel.chartSpectralSignatureS2(
    output,                             // Name of the S2 image ('output' assumes you are using starter script).
    samples
    ));
  }
);

Map.add(panel_chart);                   // To embed in app, change "Map" to "side_bar".

This work is licensed under a Creative Commons Attribution-NonCommercial-NoDerivs 4.0 International License.