PATTERNS
terrain
These methods derive topographic attributes of terrain from raster elevation data. Most terrain operations characterize attributes of a surface with focal (neighborhood) operations.
Before we get too deep into these methods, it is helpful to understand some general concepts about terrain analysis with raster data models.
change in elevation
concepts
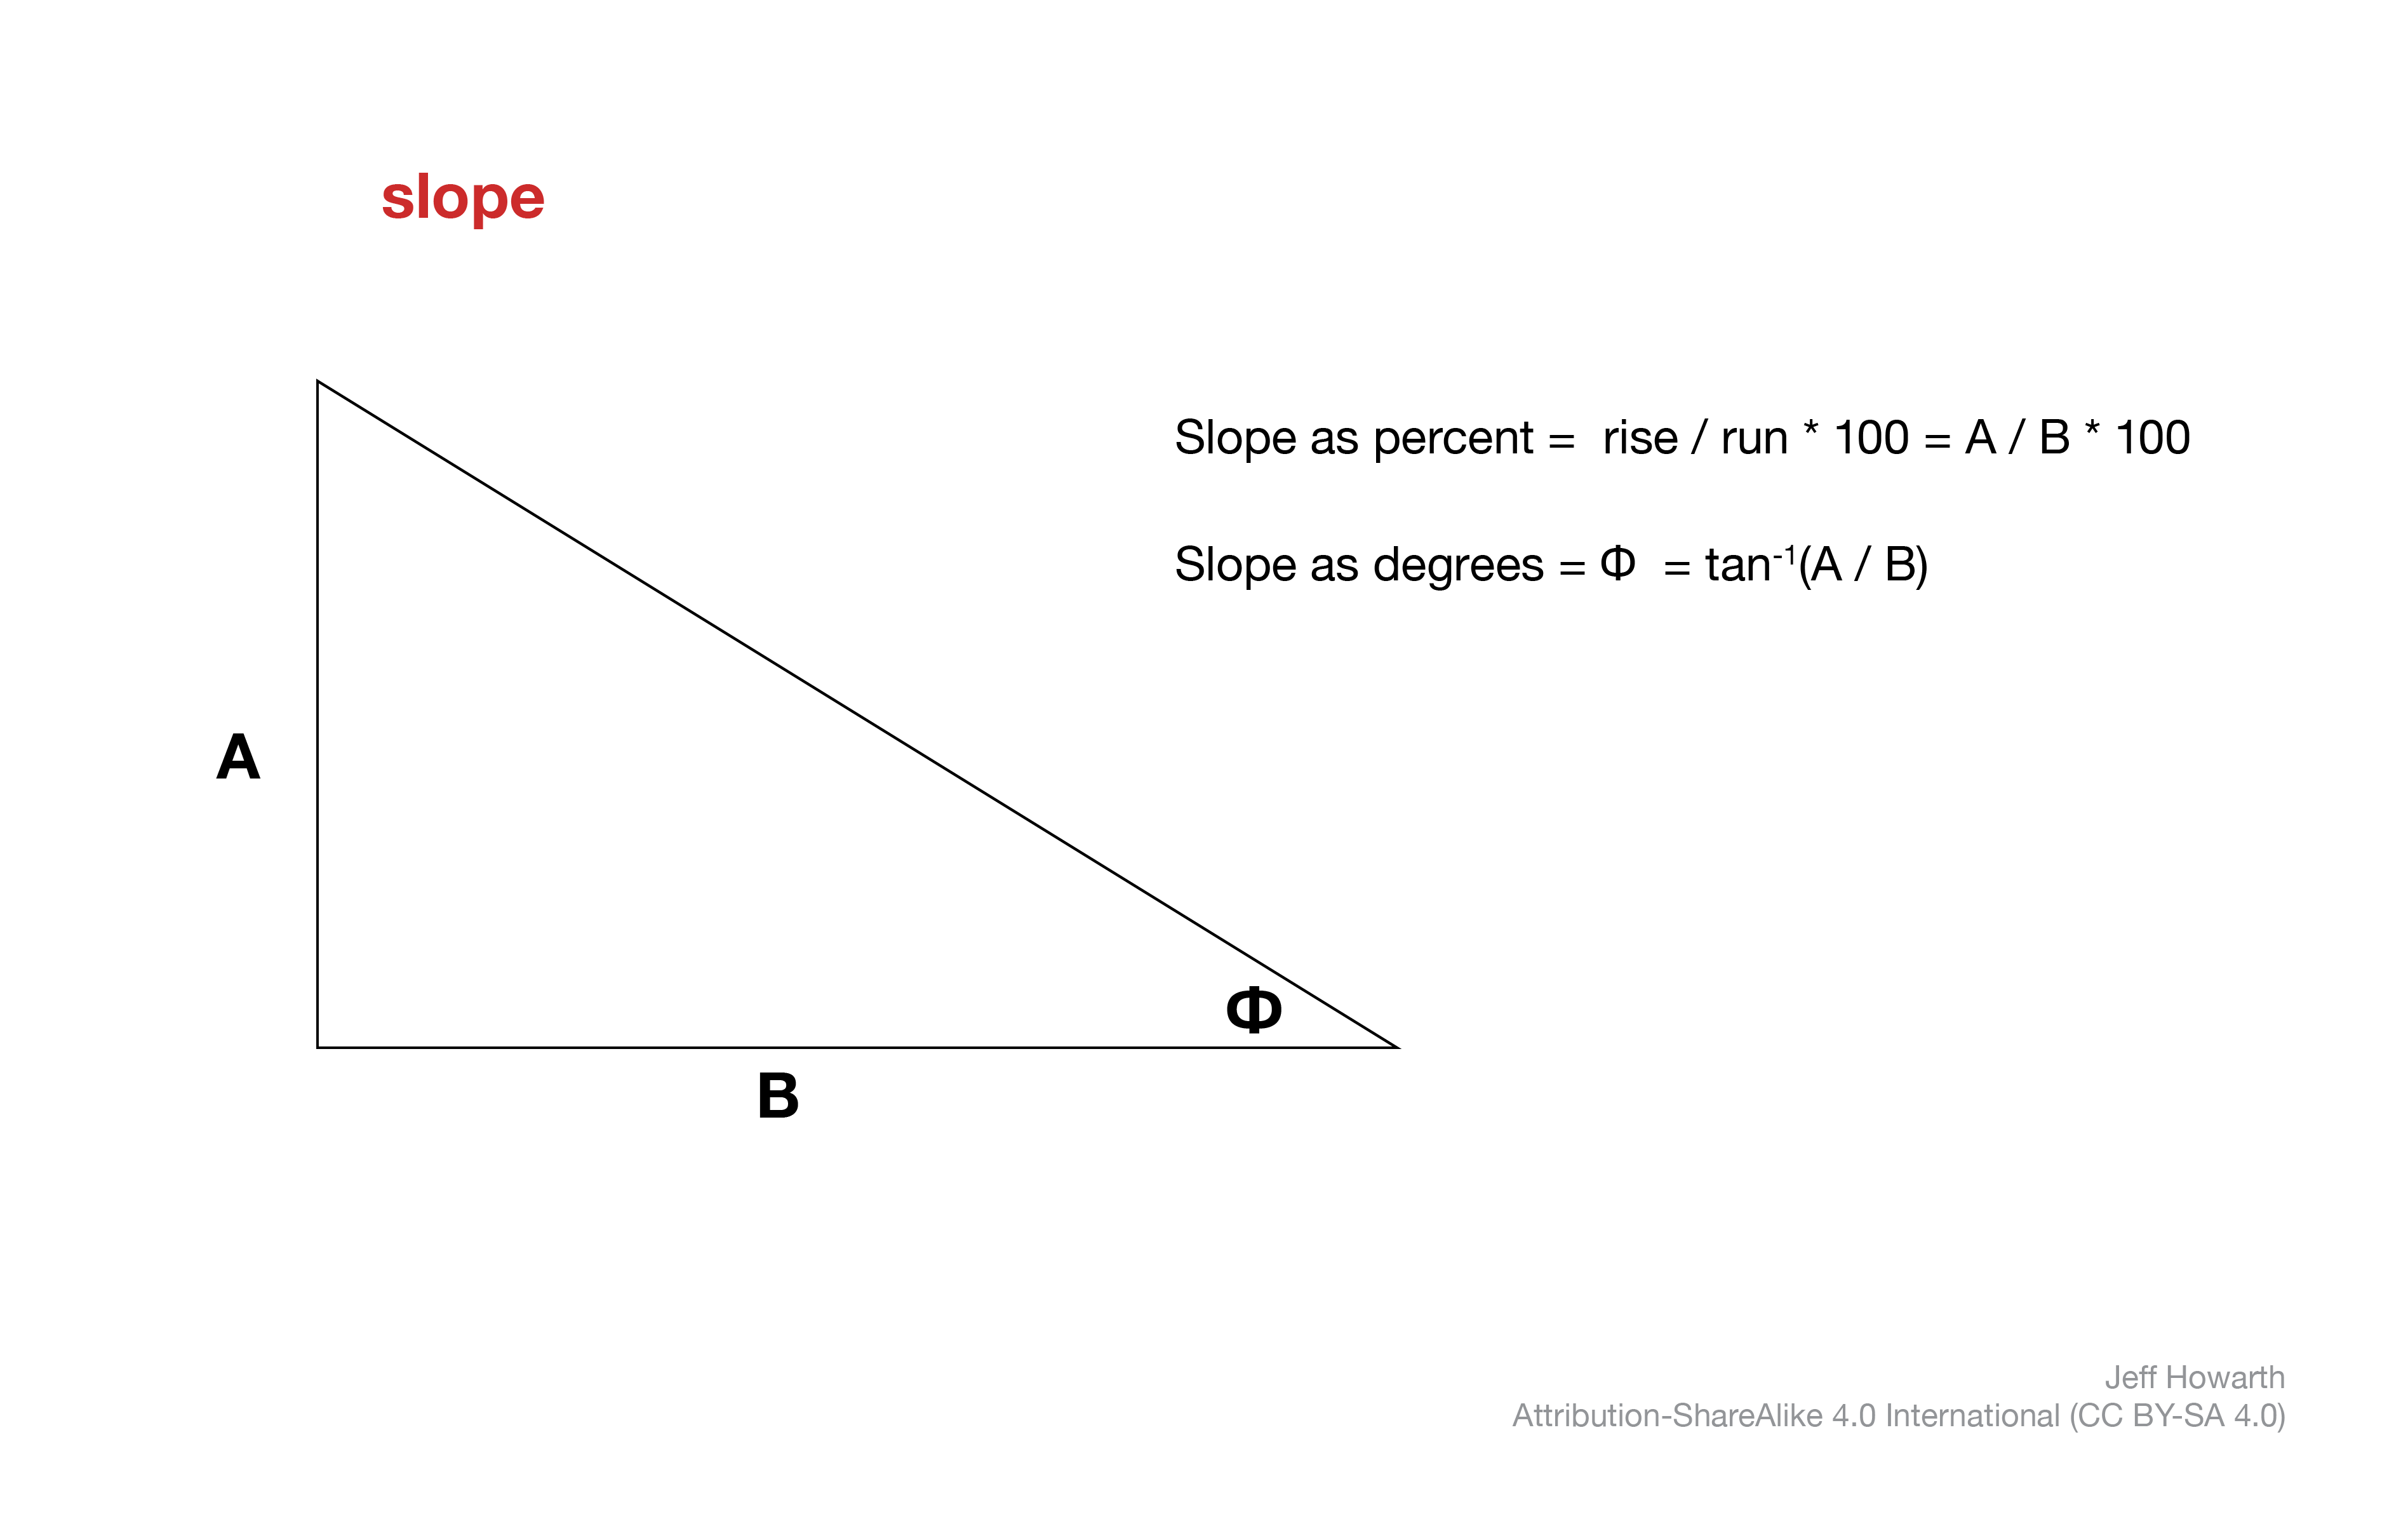
Slope describes how the vertical dimension of space changes with respect to the horizontal dimension. Many of us first learn about slope as “rise over run” which can be expressed as a percentage. Most GIS will compute slope as a percentage or in degrees. Earth Engine calculates slope in degrees and then, if you would like to find the percent slope for your application, it leaves it to you to convert from degrees to percentage with scalar operations.
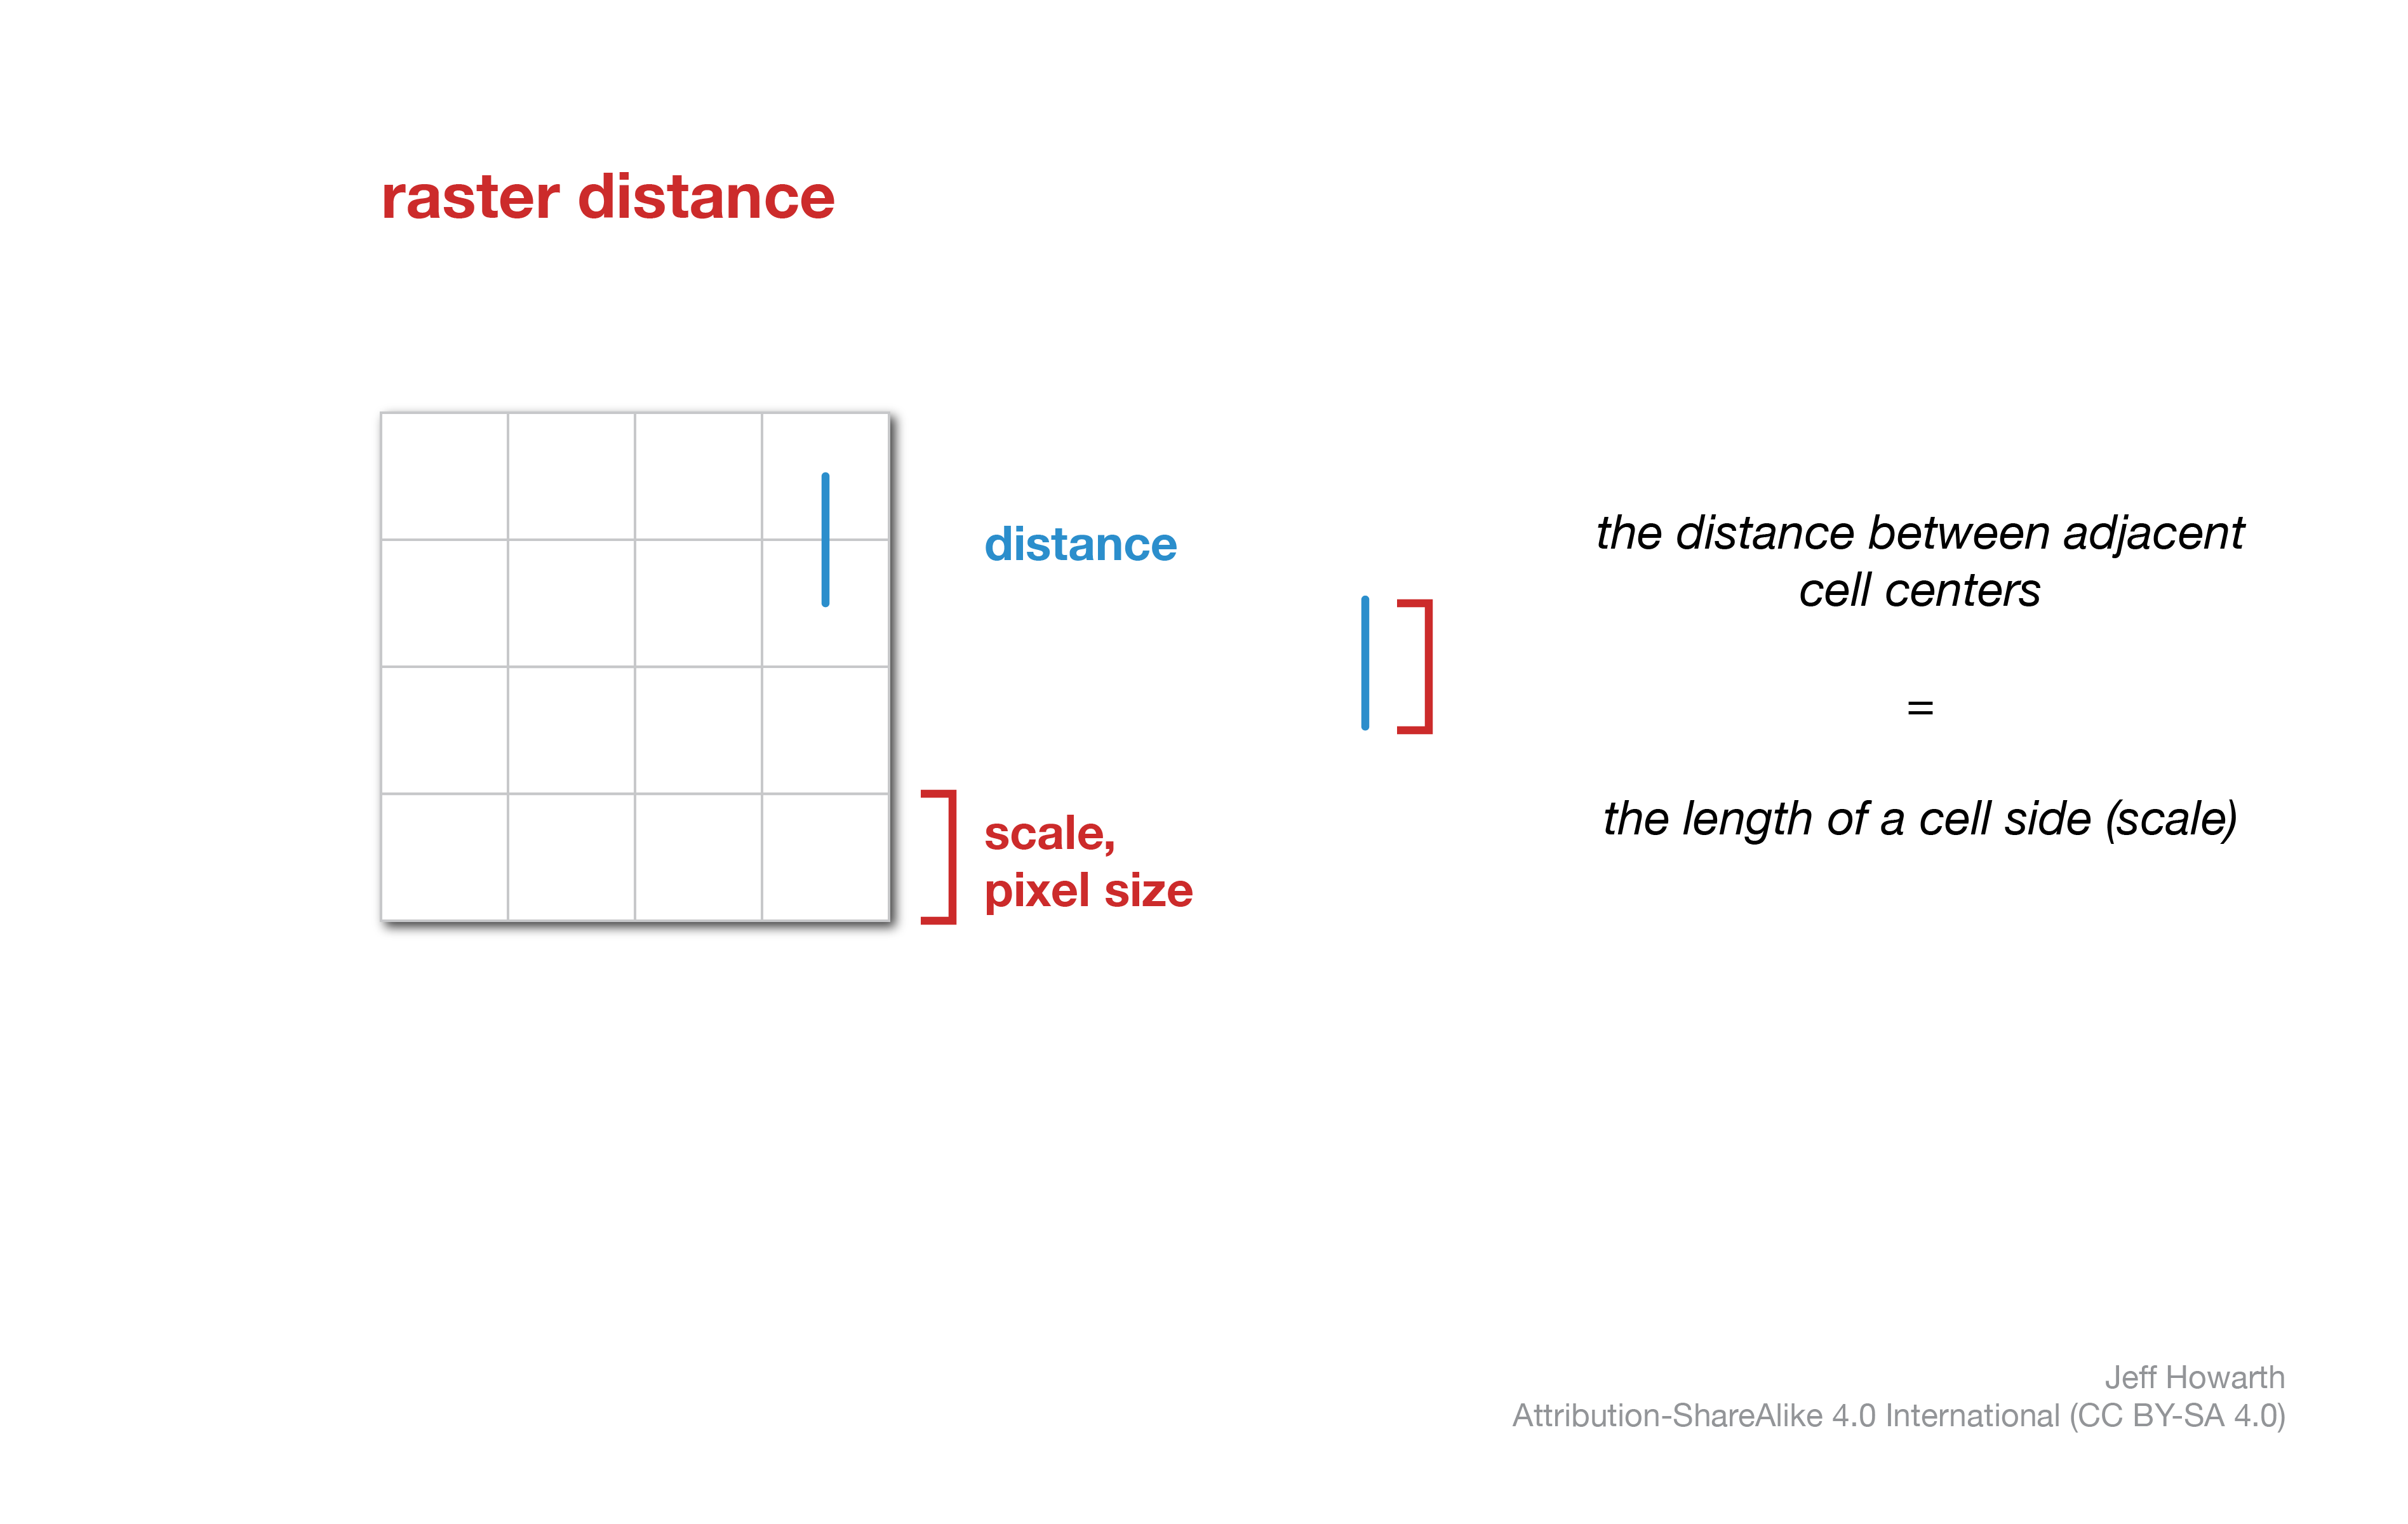
A raster model will define “run” based on distance between the centers of cells. As a result, the distance between two adjacent cells that share a side will be the same as the length of a pixel side, or the scale of the raster.
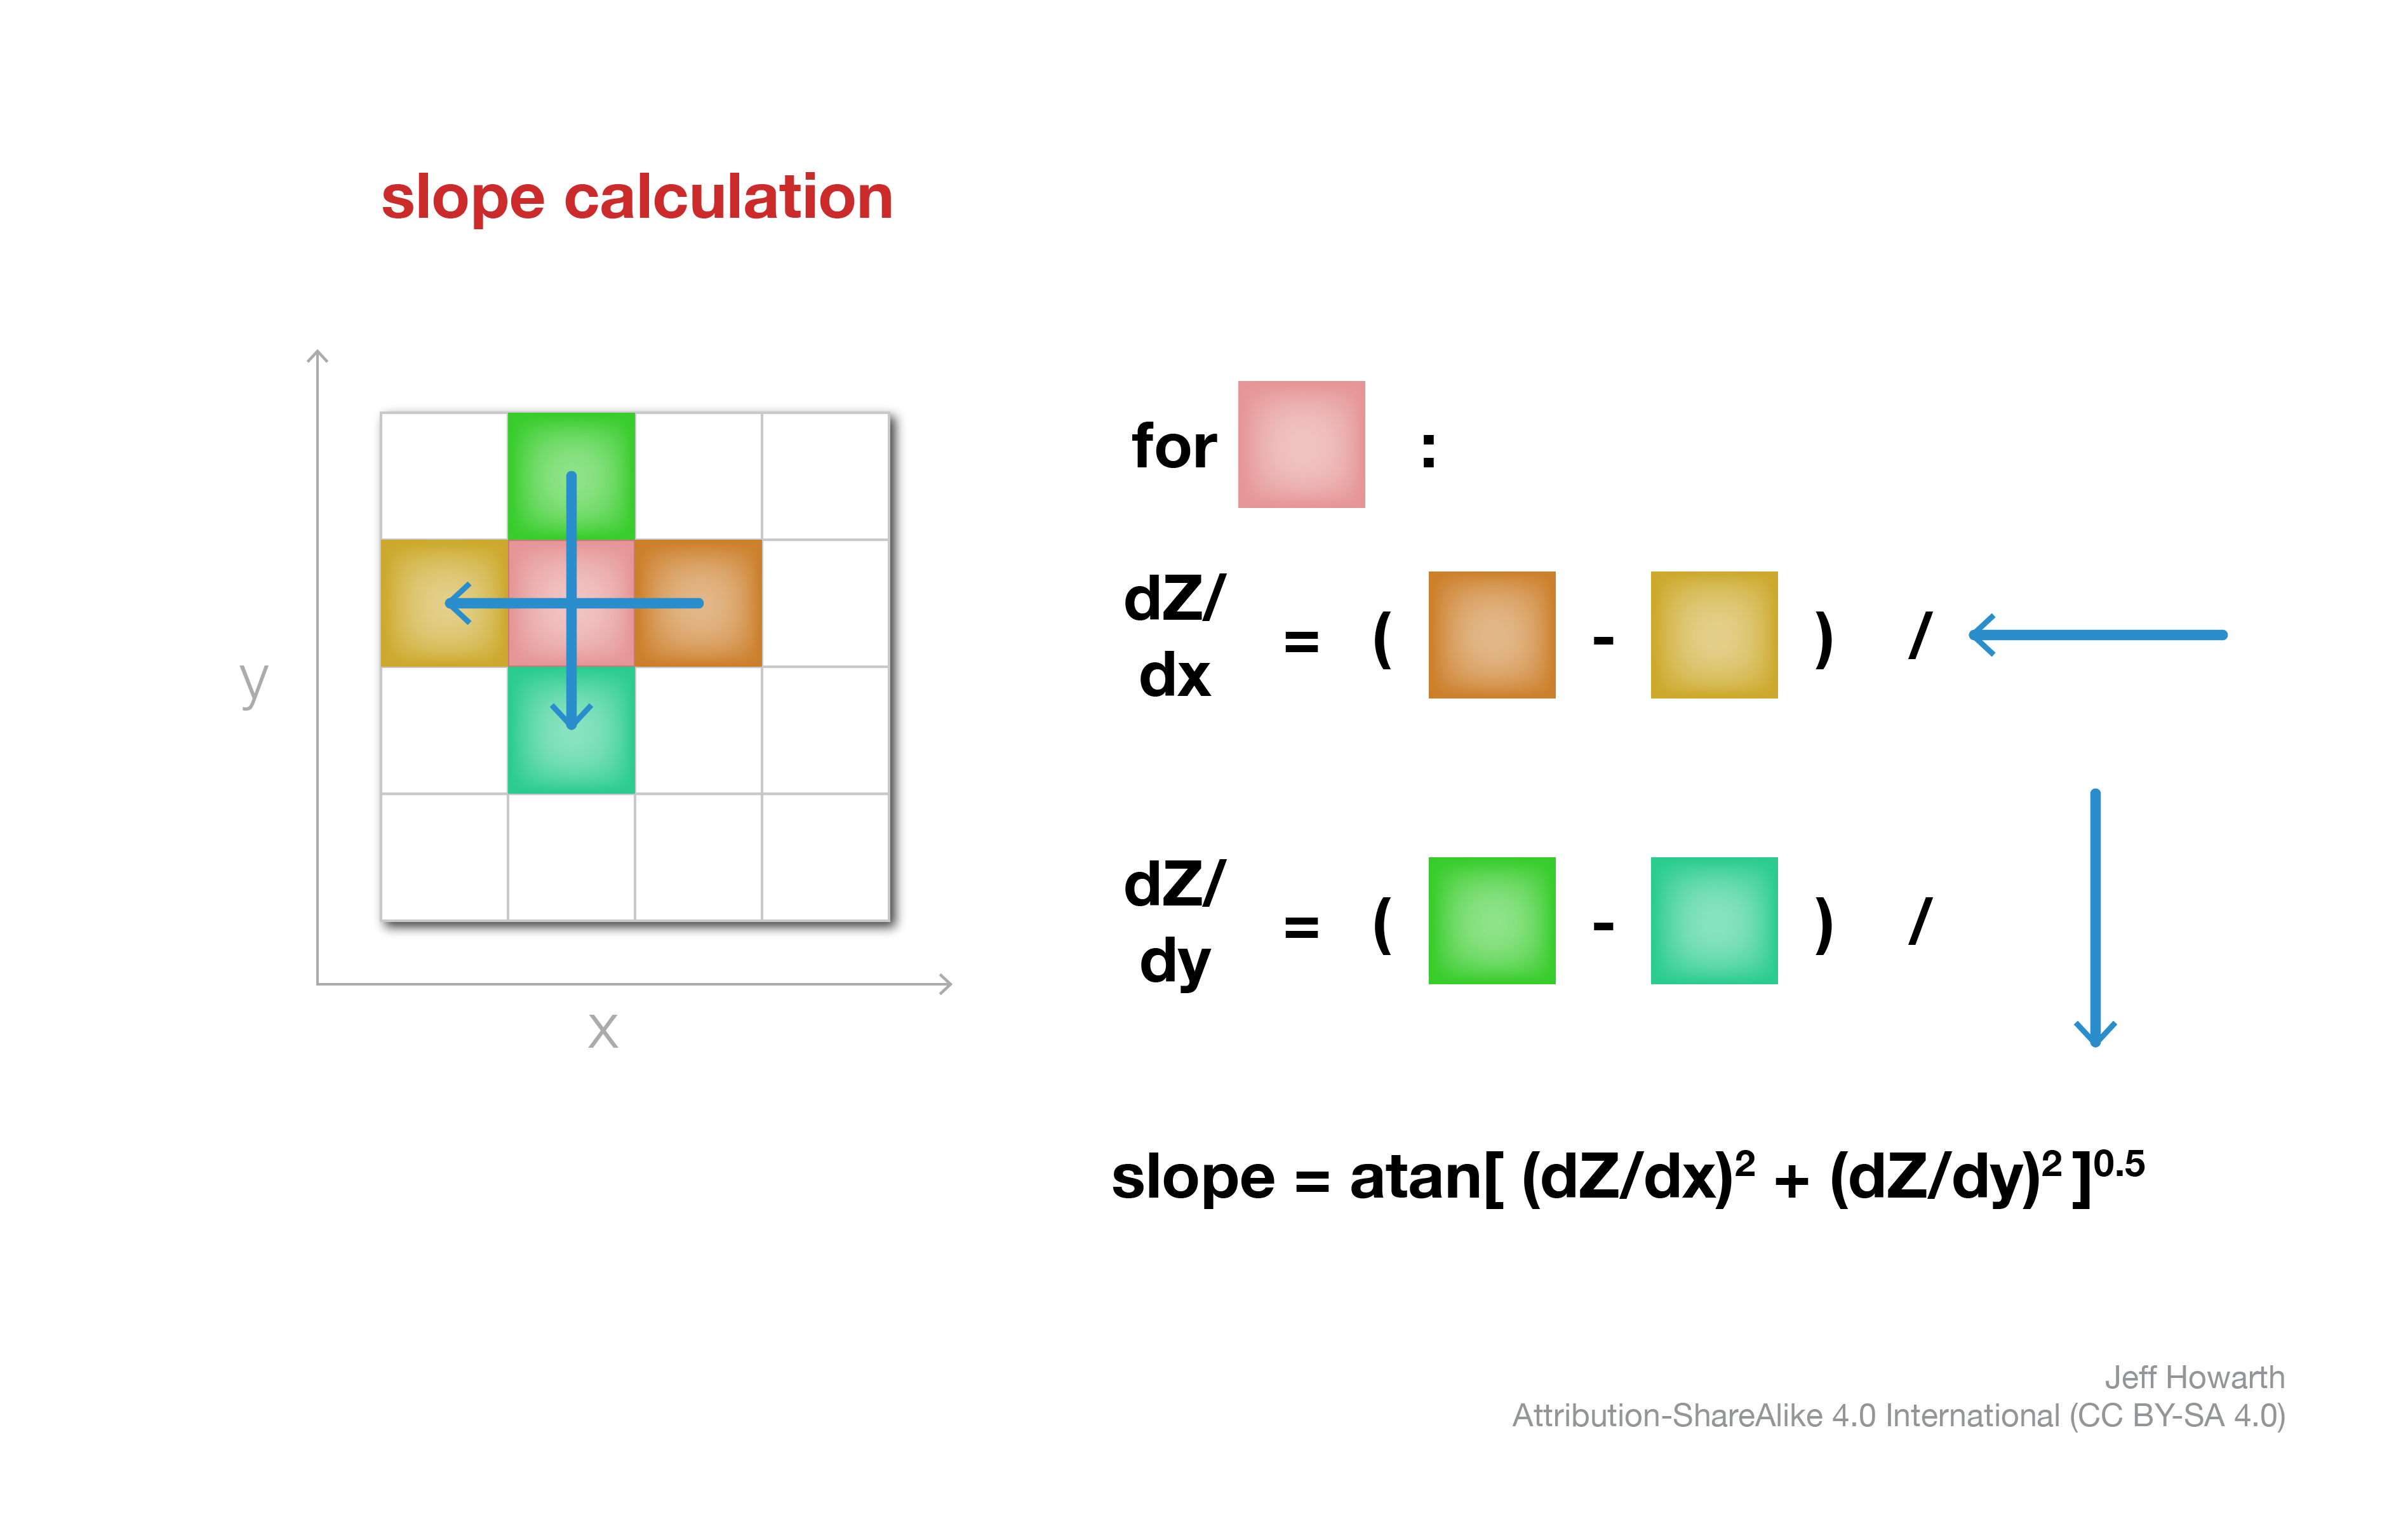
In raster analysis, a common slope computation employs a neighborhood operation with a kernel that resembles a “plus” sign. The crosspiece of the plus computes the difference in z-values (elevation) for the x dimension, while the post of the plus computes the difference in z-values for the y dimension. The change in elevation with respect to change in distance can be found by dividing by the distance across the crosspiece or post (which will both be double the cell size). The degree of slope is then found through some trigonometry.
Because the slope calculation directly compares changes in elevation with changes in distance, the units of the z-values must be the same as the units of the xy values. In Earth Engine, the xy units will generally be meters. Therefore, accurate slope computations require elevation data in meters.
decision flow
The workflow for slope analysis will often depend on the data you are using and your purpose. I tend to think through some version of the flowchart depicted below. The
graph TD
q1>"Do z-units = xy units?"] ;
q2>"Is your purpose to visualize slope shading?"] ;
q3>"Does your application require slope in percent?"] ;
step01("Change units \n\n APPLY SCALAR") ;
step02("Consider changing z-factor \n\n APPLY SCALAR") ;
step03("Derive slope") ;
step04("Convert slope units") ;
step05(😎);
q1-- NO -->step01 --> q2
q1-- YES -->q2
q2-- YES -->step02
q2-- NO -->step03
step02 --> step03
step03 --> q3
q3-- YES --> step04
q3 -- NO --> step05
step04 --> step05
classDef task fill:#DDE6C3,stroke-width:0px,color:#000000;
classDef check fill:#C3D1E6, stroke-width:0px,color:#000000;
classDef done fill:#FFFFFF, stroke-width:0px,color:#000000;
class q1 check;
class q2 check;
class q3 check;
class step01 task;
class step02 task;
class step03 task;
class step04 task;
class step05 done;
slope method
Derive slope of a surface in degrees from elevation in meters.
Call the ee.Terrain.slope method with the elevation data (with z-units meters) as the argument.
graph LR
  step02("ee.Terrain.slope()") ;
  step03[/"image_slope"/]  ;
  arg01["image_elevation_meters"] ;

  step02 --> step03
  arg01 --o step02


  classDef in-out fill:#FFFFFF,stroke-width:1px,stroke: #000000, color:#000000;
  classDef op fill:#000000,stroke-width:0px,color:#FFFFFF;
  classDef arg fill:#CCCCCC,stroke-width:0px,color:#000000;


  class step01 in-out;
  class step02 op;
  class step03 in-out;
  class arg01 arg;
var image_slope = ee.Terrain.slope(image_elevation_meters);
direction of change
concepts
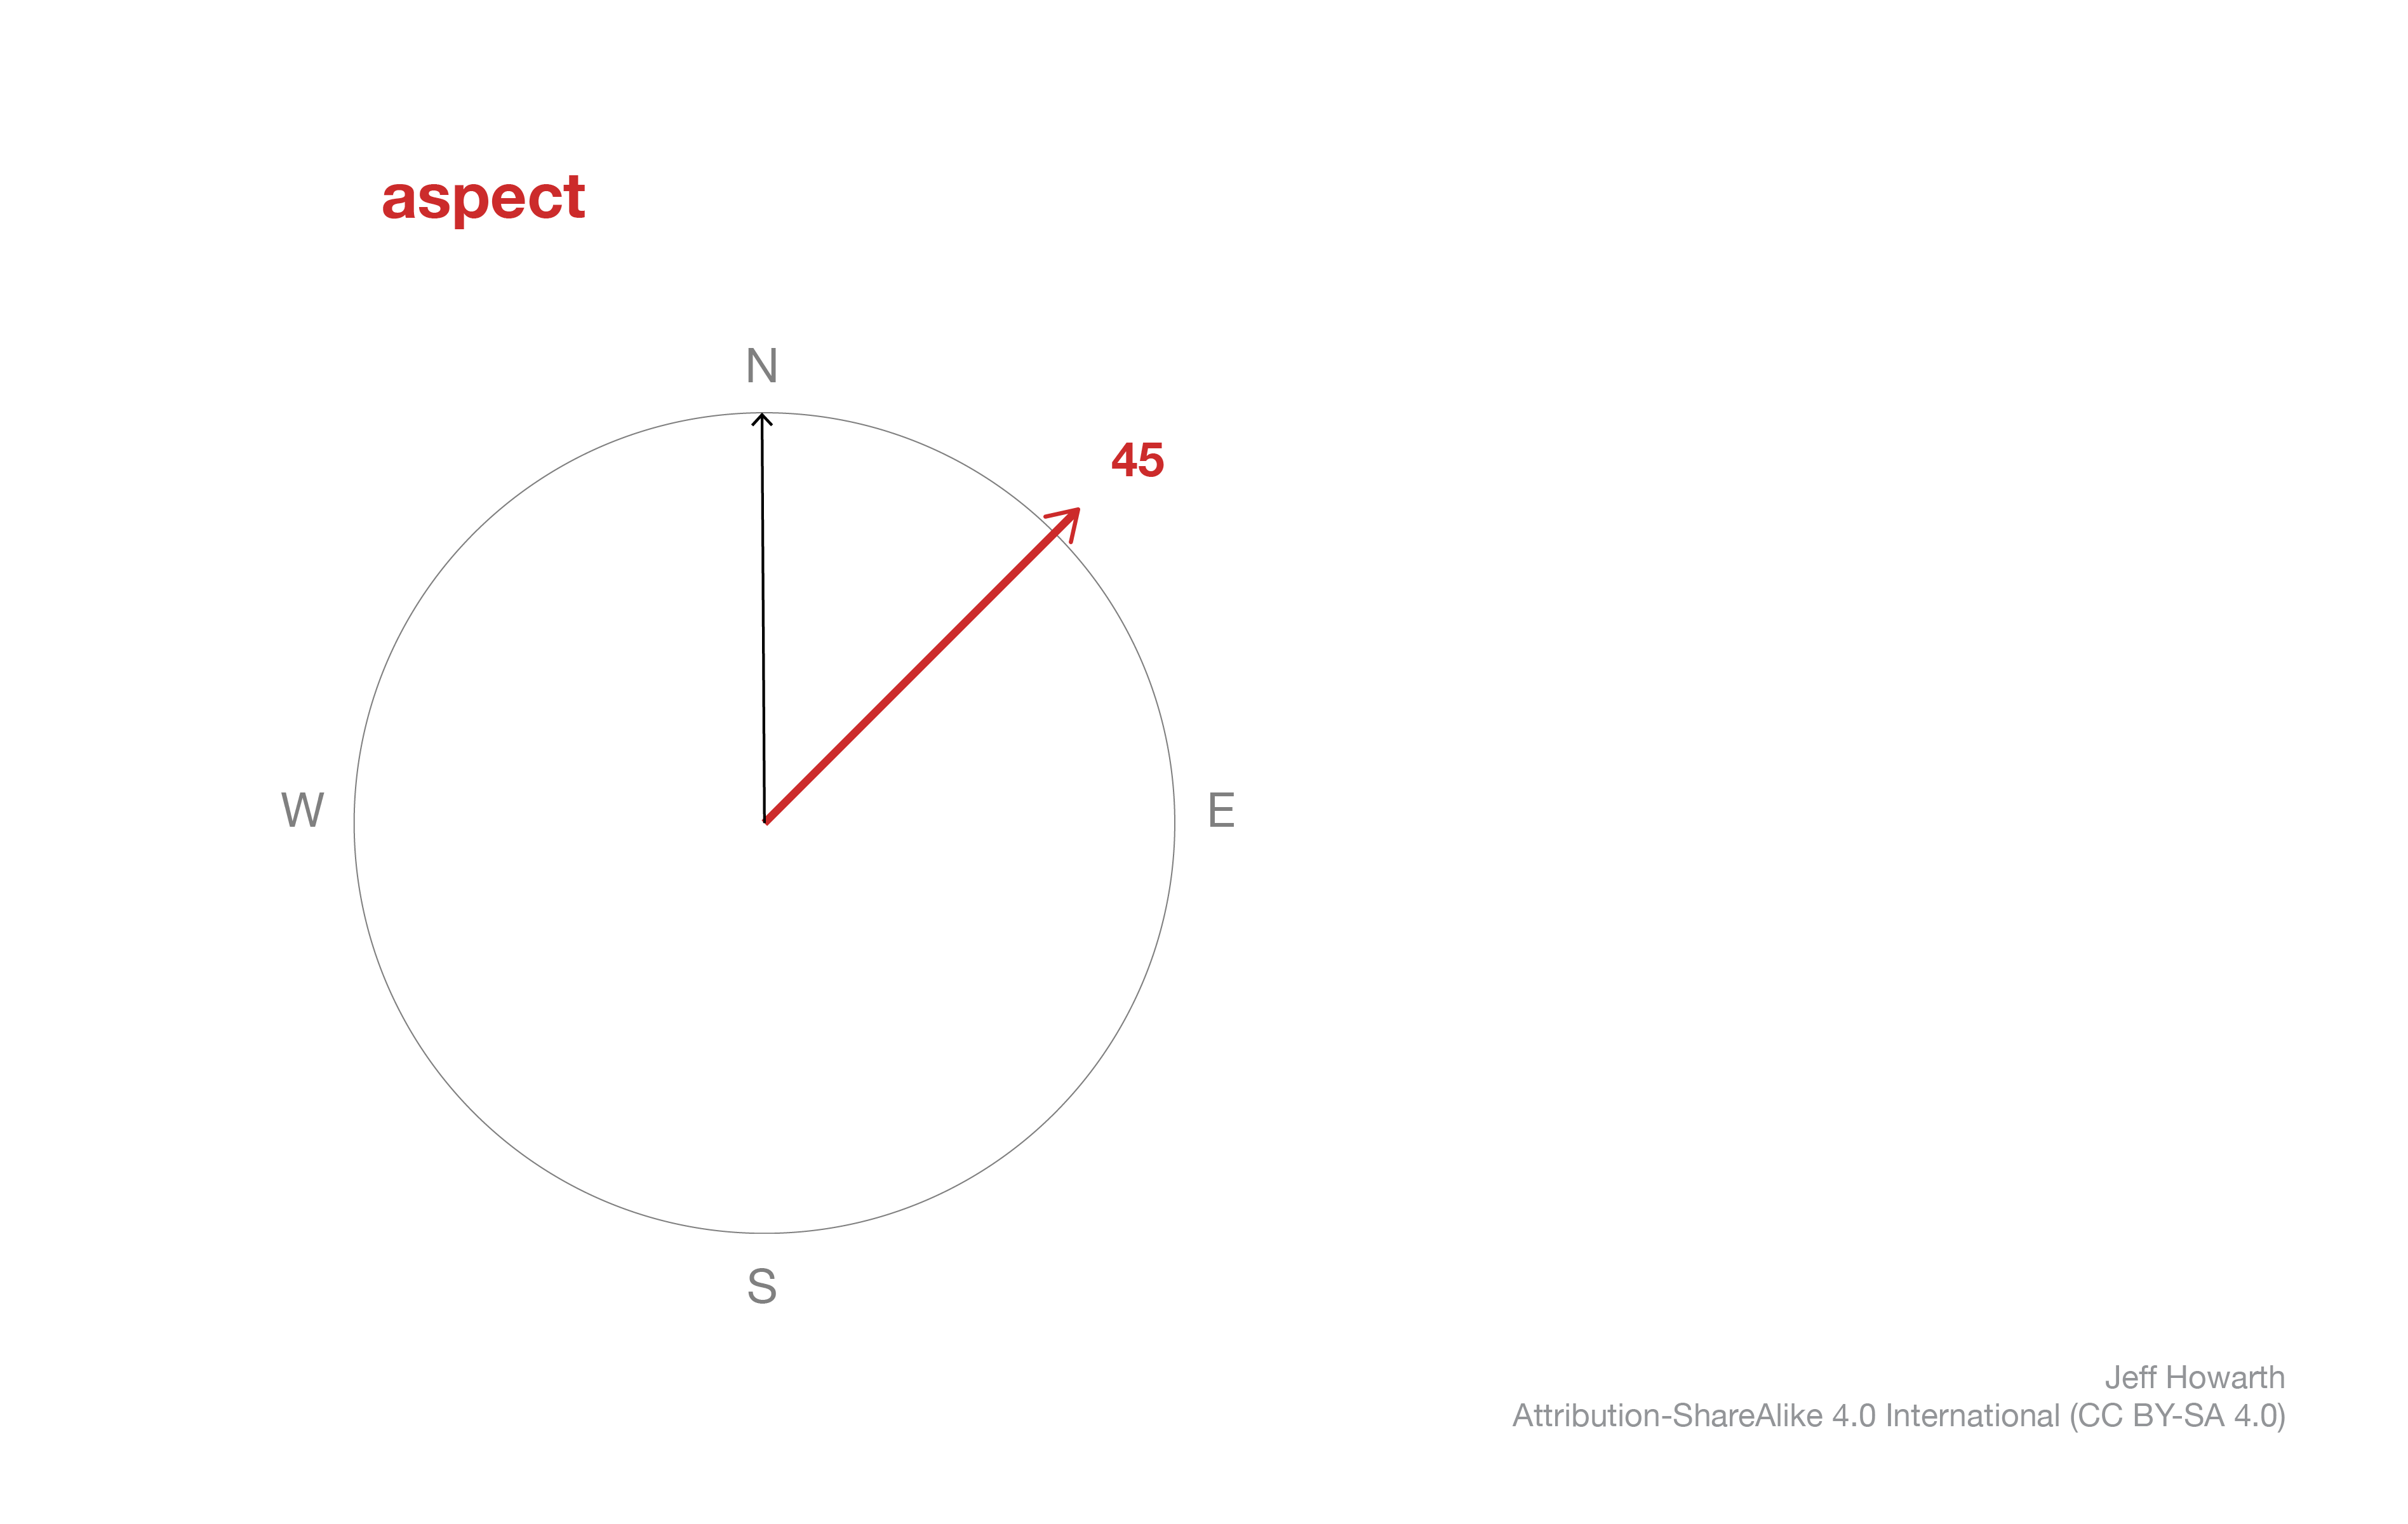
Closely related to slope, aspect reports the direction of change, or the steepest downhill direction of a pixel.
Like slope, aspect is derived with a kernel that computes change in elevation in both x- and y- dimensions, but rather than reporting the steepness of the slope, aspect reports the direction, generally expressed as an azimuthal angle from North 0.
aspect method
In Earth Engine, the aspect method closely resembles the pattern for slope.
graph LR
  step02("ee.Terrain.aspect()") ;
  step03[/"image_aspect"/]  ;
  arg01["image_elevation_meters"] ;

  step02 --> step03
  arg01 --o step02


  classDef in-out fill:#FFFFFF,stroke-width:1px,stroke: #000000, color:#000000;
  classDef op fill:#000000,stroke-width:0px,color:#FFFFFF;
  classDef arg fill:#CCCCCC,stroke-width:0px,color:#000000;


  class step01 in-out;
  class step02 op;
  class step03 in-out;
  class arg01 arg;
var image_aspect = ee.Terrain.aspect(image_elevation_meters);
Because the method directly compares changes in z-values to changes in x- and y- values, the units for elevation must match the units for x- and y- dimensions. Practically, this means the elevation units must be meters.
The output aspect image reports the direction of slope in degrees. Completely flat pixels (with no slope direction) receive the value 0. It is often good practice to mask these pixels so as not to confuse them with north-facing locations.
analytic hillshading
concepts
Shaded relief is a method to visualize a three-dimensional surface by creating the illusion of highlights and shadows thrown by sunlight on a terrain. Before computers, cartographers created shaded relief by hand (manual shaded relief) in a workflow that blended science and art. Most GIS software now provide a method to automate shaded relief, called analytic hillshading, that simplifies the shading illusion.
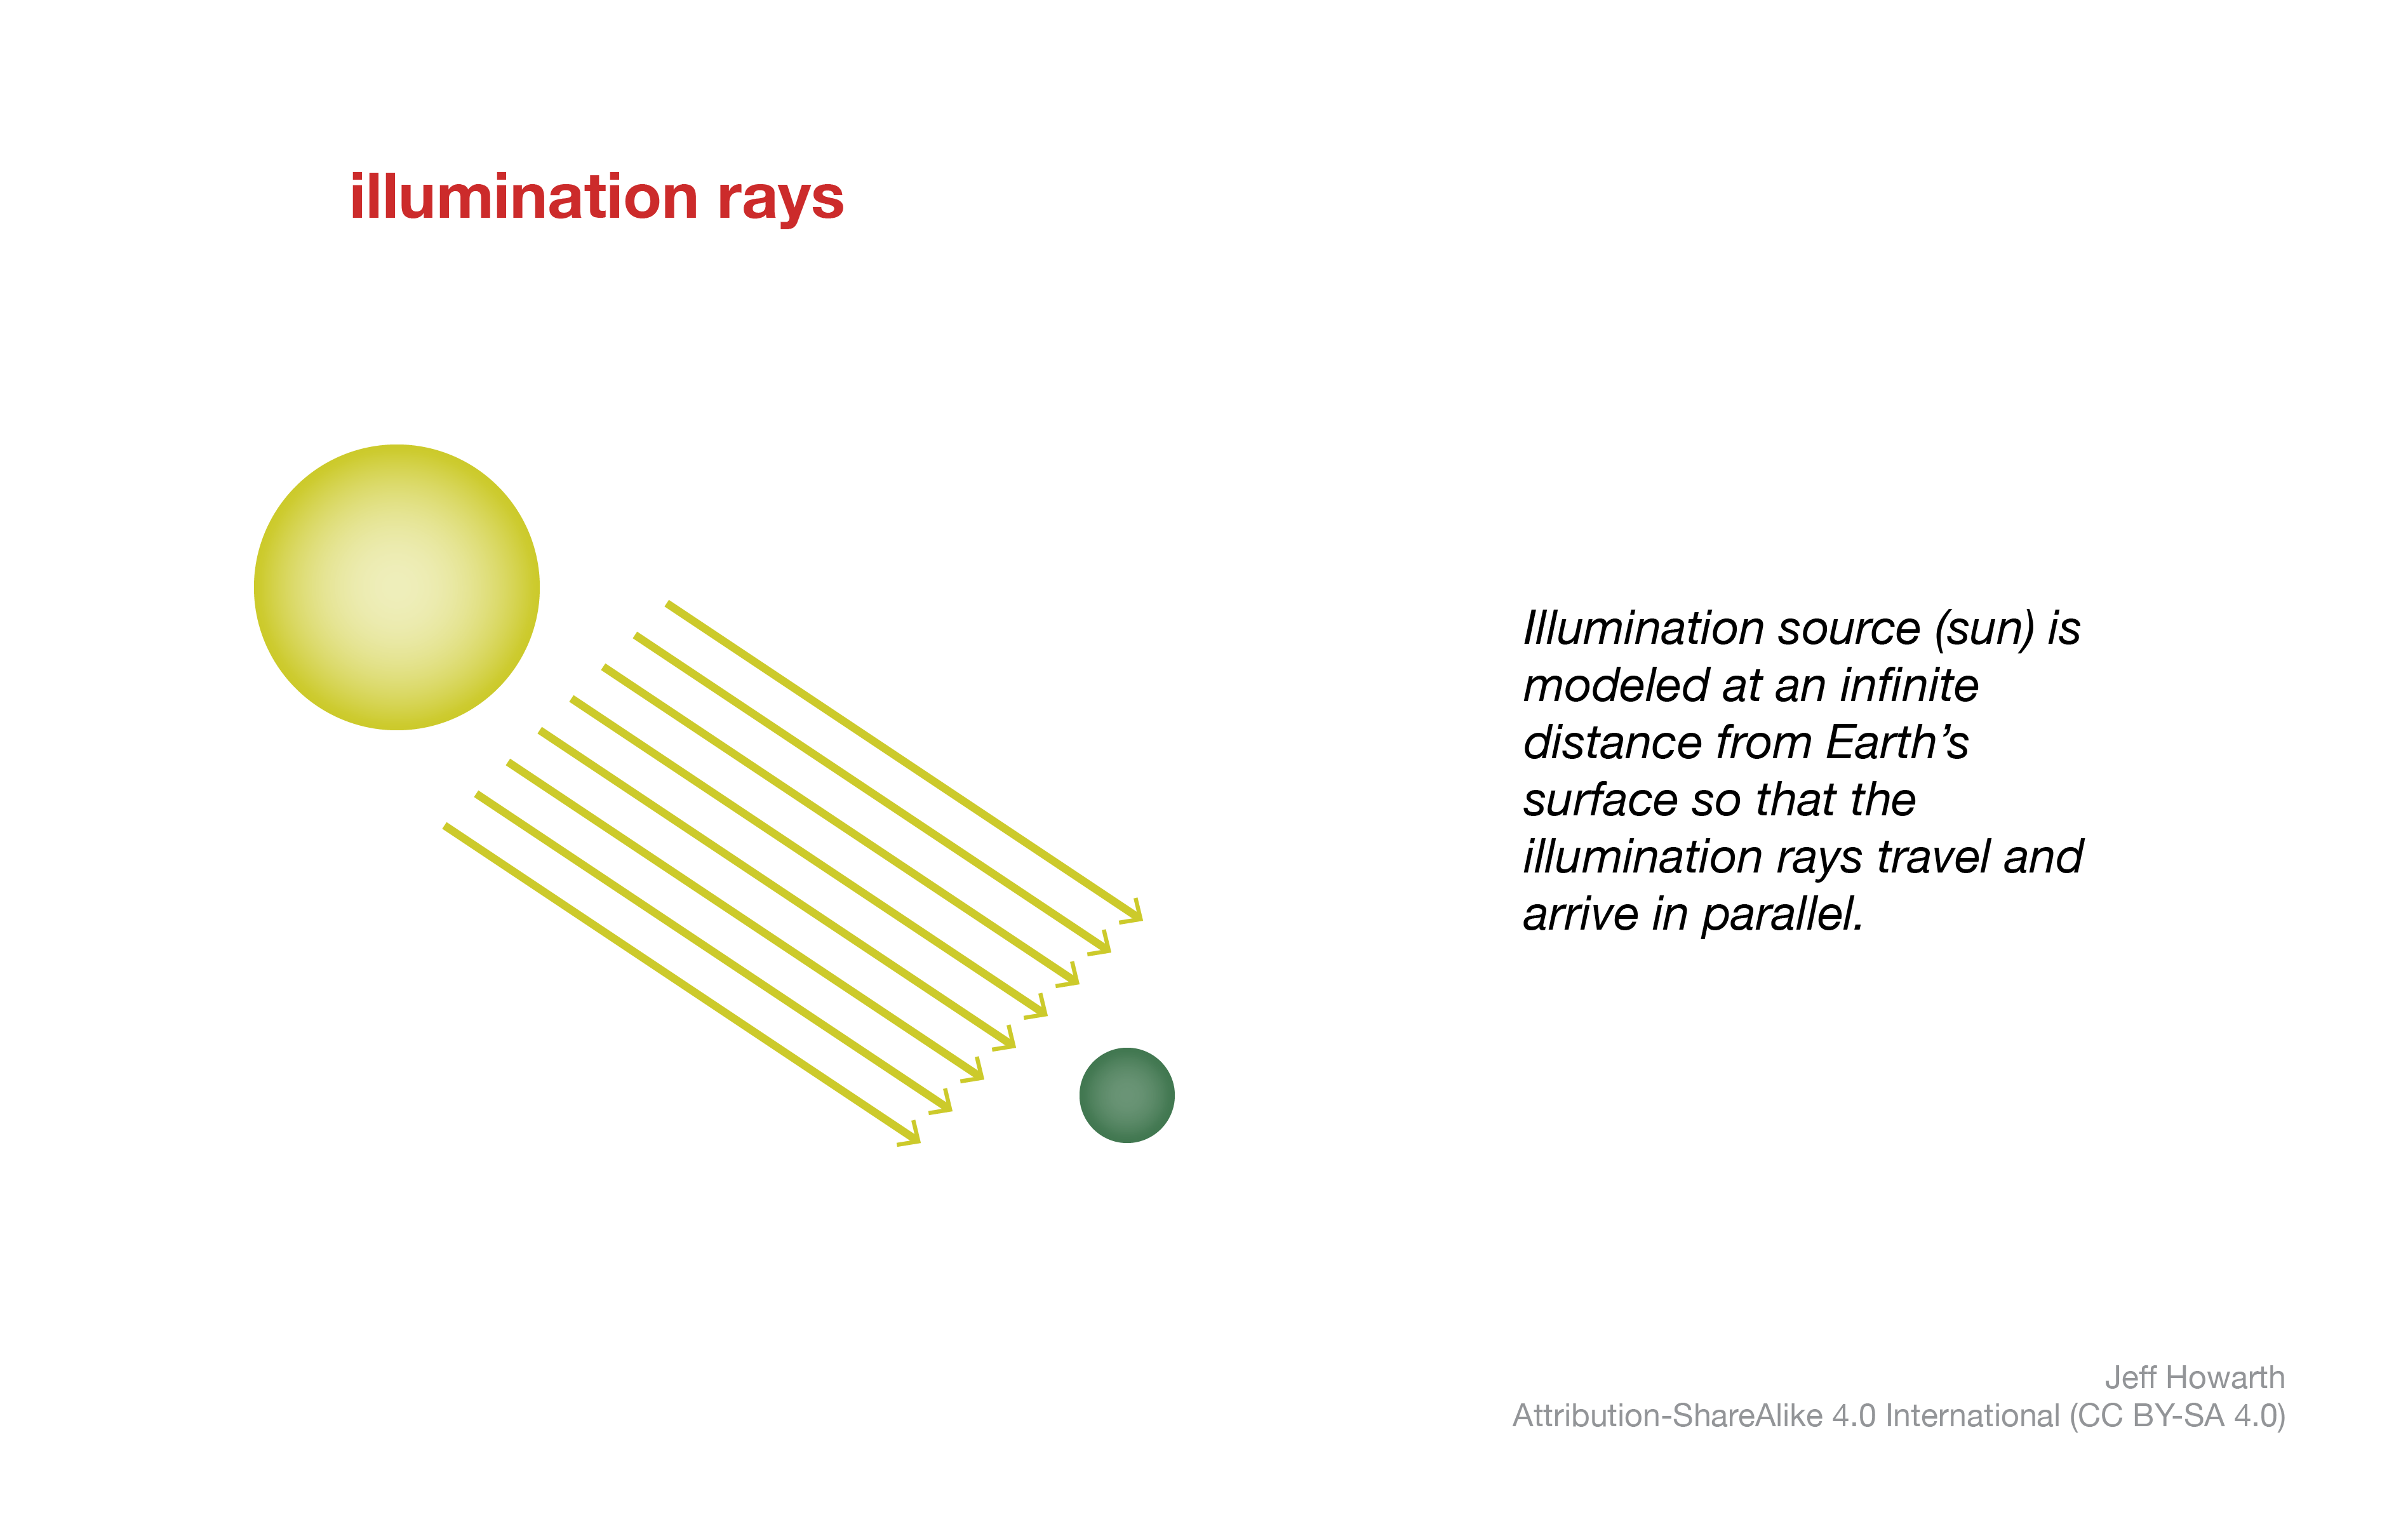
The method assumes that the illumination source (sun) is an infinite distance from Earth. As a result, the illumination rays travel and reach the Earth’s surface in parallel.
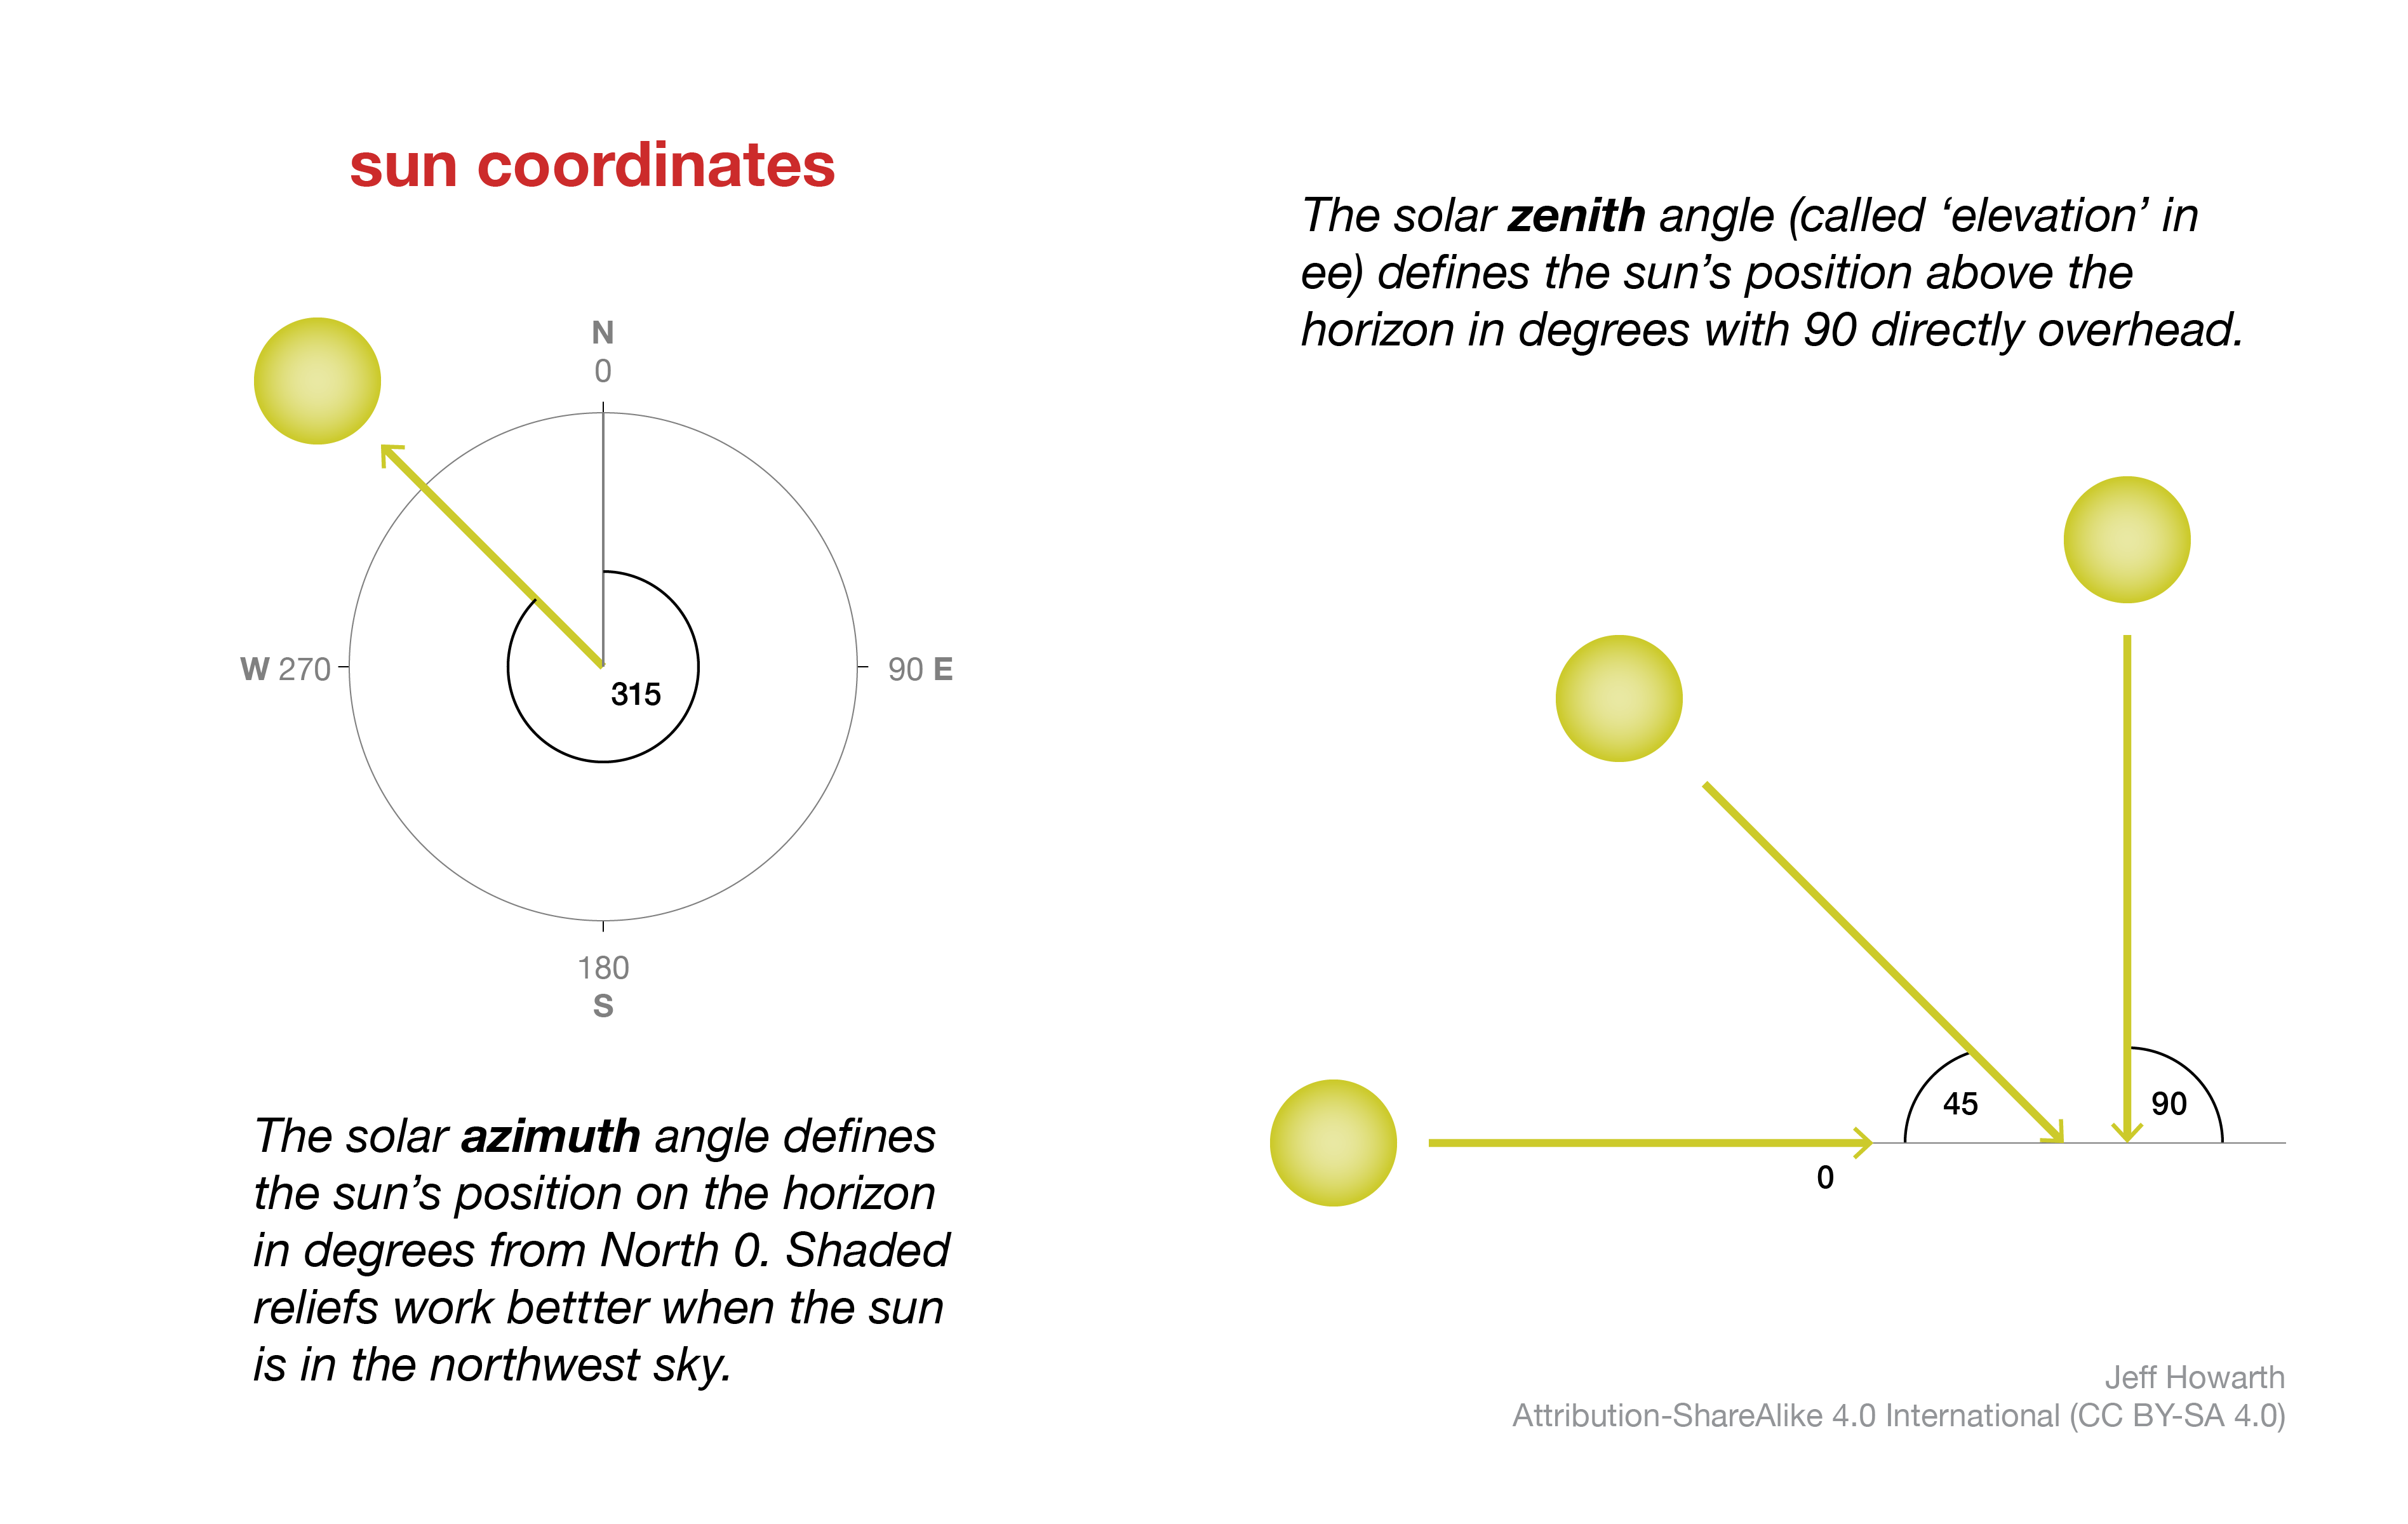
The angle of the illumination rays depends on the sun’s position, which is determined by two coordinates. The solar azimuth angle defines the sun’s position on the horizon in degrees from North. It is often most effective to put the illumination source above the northwest horizon, even though in the northern hemisphere it would be unusual to find the sun in this part of the sky. An interesting fact about the illusion of shaded relief is that placing the illumination source in the southern sky will make the landscape appear inverted: mountain ridges look like valleys and creeks look like ridge lines. Because of this, many analytic hillshade tools in GIS will use 315 as the starting solar azimuth angle. You can then adjust this ± 30 degrees depending on the orientation of ridges and valleys in the area of interest, while taking care not to invert the landscape by pushing the sun too far.
The second solar coordinate the defines the sun’s position above the horizon, or how high the sun hangs in the sky. Many GIS call this the zenith angle, but in Earth Engine it is called elevation. If the sun is directly overhead, the zenith angle is 90 and the sun approaches 0 as it nears the horizon. By default, many GIS go with the Goldilocks solution and set the zenith angle at 45. It is often good to start here and then adjust based on your terrain. Lowering the zenith angle can be helpful on flat terrain, while raising the angle can be helpful in more rugged landscapes.
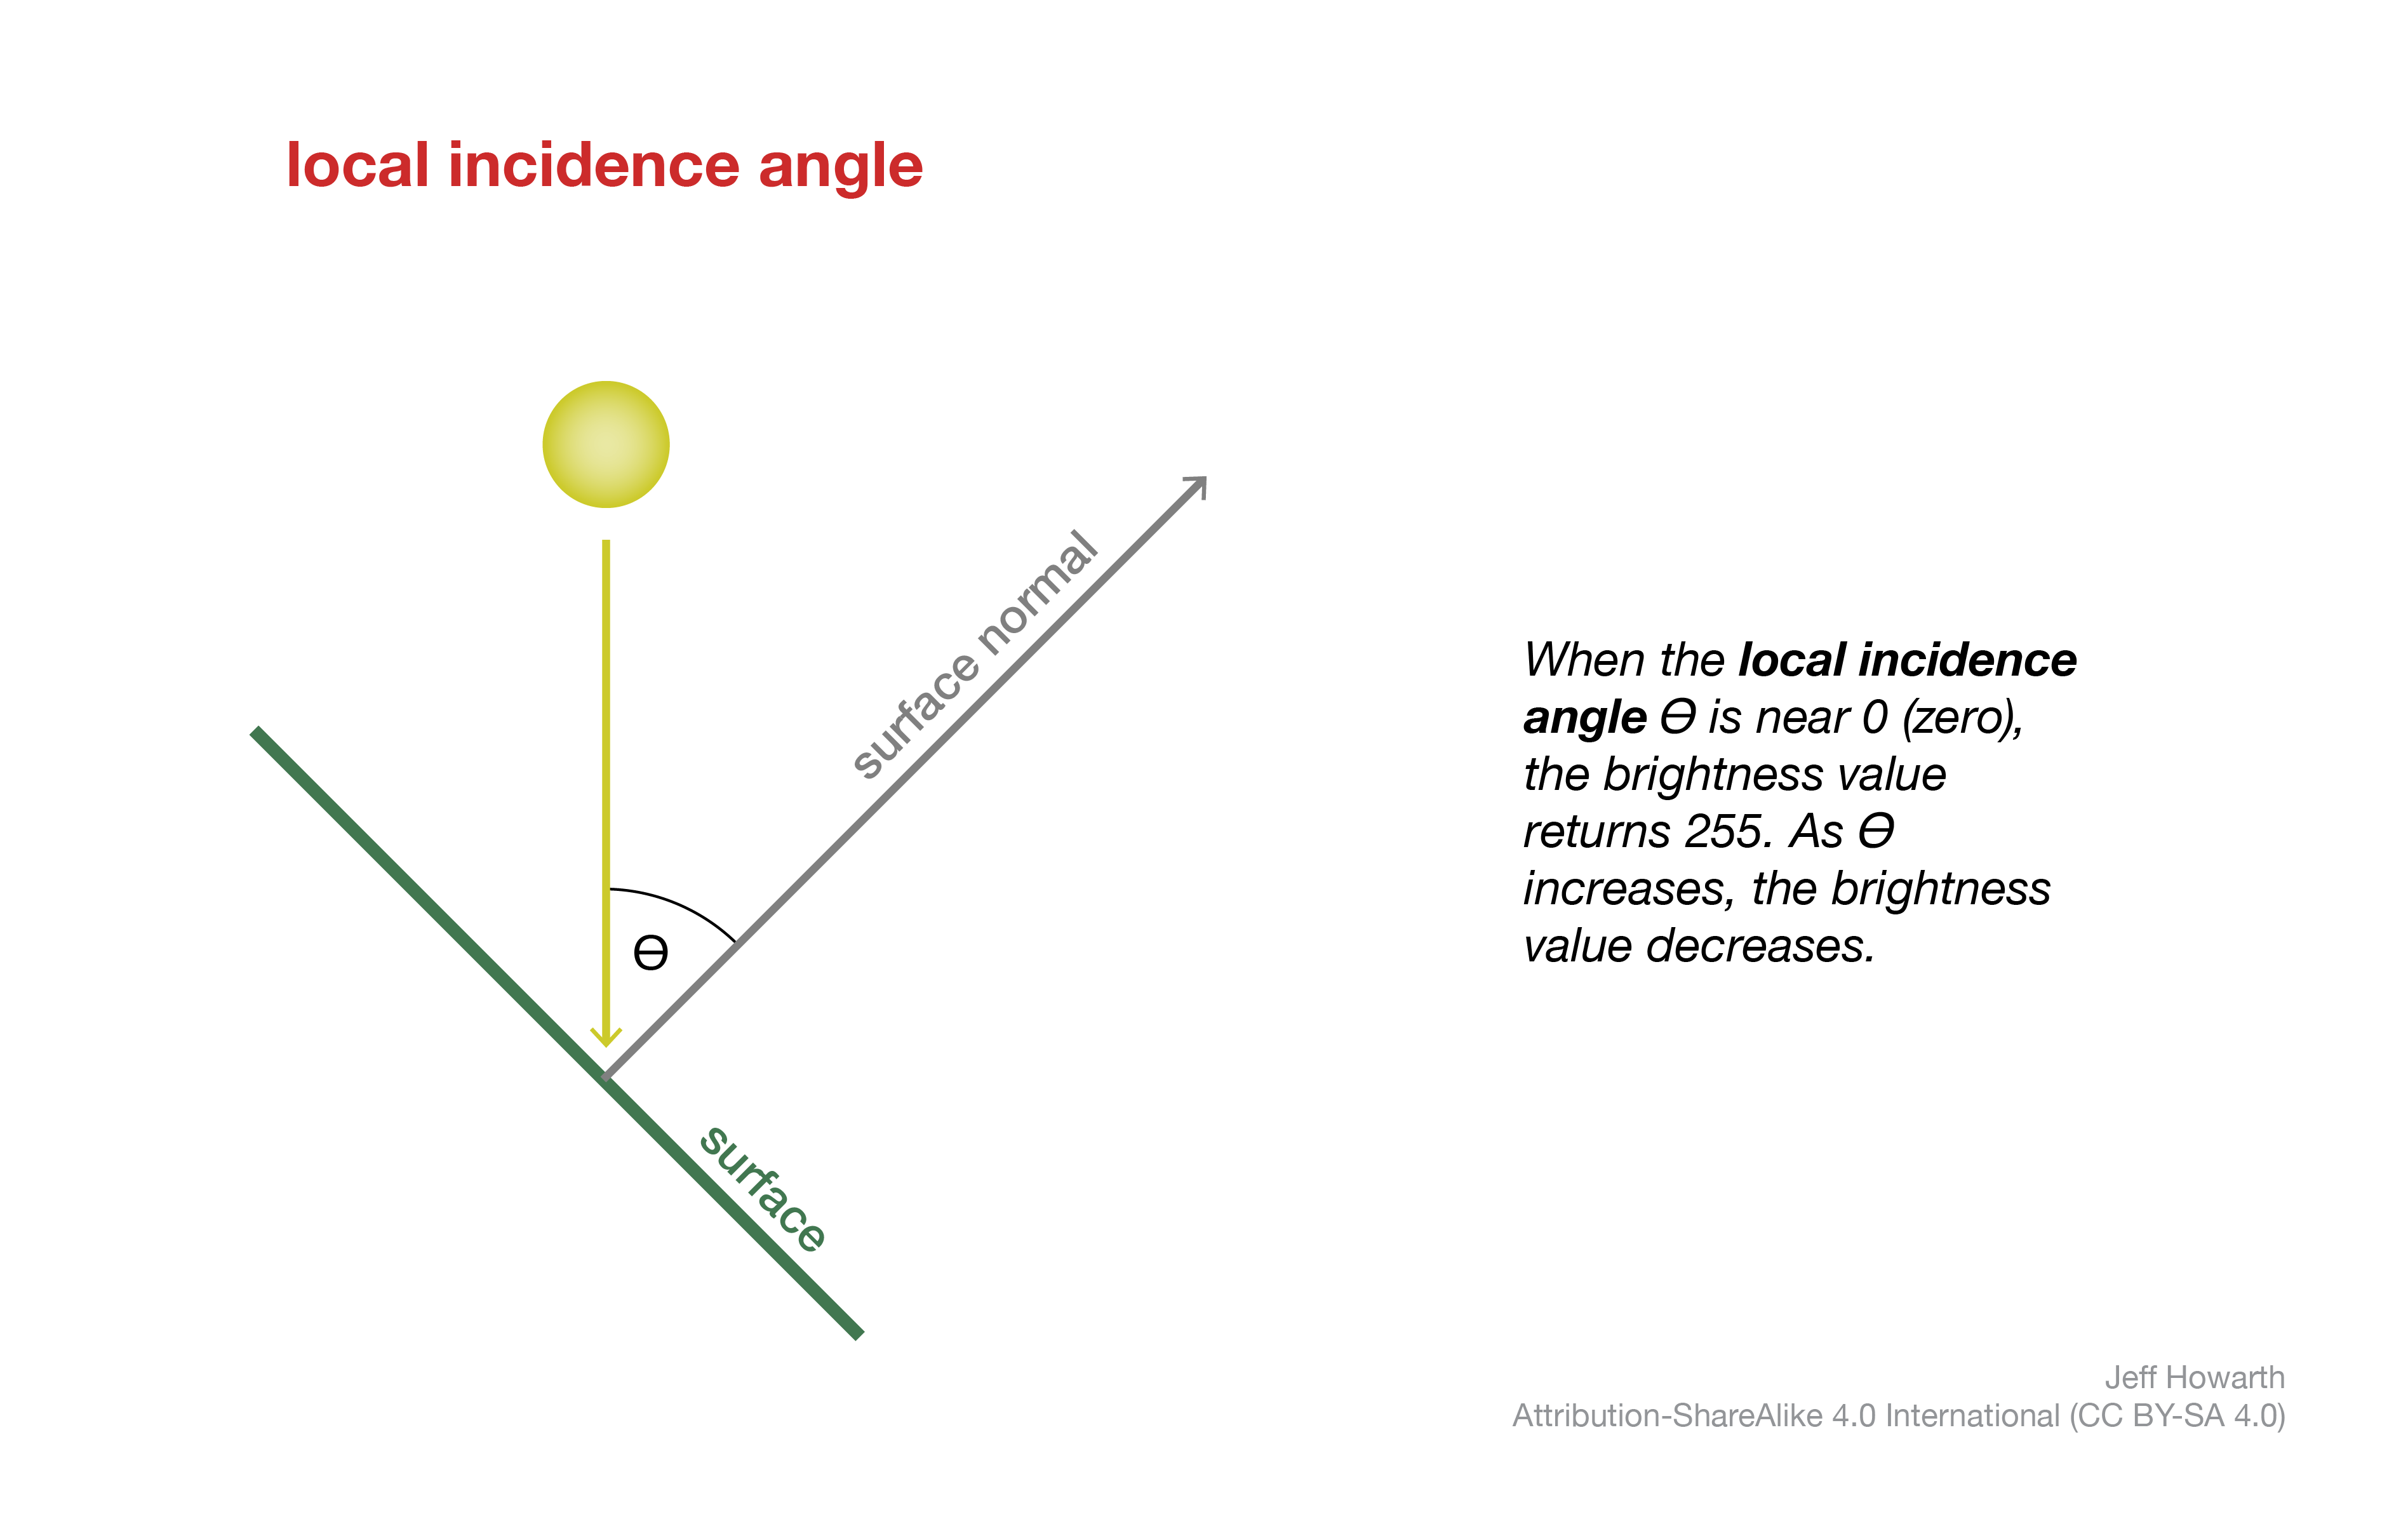
The brightness of the reflected ray is determined by the local incidence angle from the surface normal (perpendicular to the surface). When the incidence angle is near 0, the rays directly strike the surface and reflect at their brightest power. Because most GIS will store the output of the analytic hillshade method as a byte data type (0-255), the brightest pixels will have the data value 255. In a grayscale palette, this value will be displayed white. As the incidence angle increases, the rays strike the surface obliquely, the brightness values decrease, and the display values change from white to gray. As the angle exceeds 90, the brightness values change from gray to black.
hillshade operation
In Earth Engine, the ee.Terrain.hillshade() method takes three arguments to output a hillshade image.
graph LR
  step02("ee.Terrain.hillshade()") ;
  step03[/"image_hs"/]  ;
  arg01["image_elevation_meters"] ;
  arg02["azimuth angle"] ;
  arg03["zenith angle"] ;

  step02 --> step03
  arg01 --o step02
  arg02 --o step02
  arg03 --o step02

  classDef in-out fill:#FFFFFF,stroke-width:1px,stroke: #000000, color:#000000;
  classDef op fill:#000000,stroke-width:0px,color:#FFFFFF;
  classDef arg fill:#CCCCCC,stroke-width:0px,color:#000000;


  class step01 in-out;
  class step02 op;
  class step03 in-out;
  class arg01 arg;
  class arg02 arg;
  class arg03 arg;
var image_hs = ee.Terrain.hillshade(image_elevation_meters, azimuth, zenith);
 deviation from mean elevation
Description forthcoming
var image_dme = geo.iTerrain.devFromMeanElev(image, 10);
This work is licensed under CC BY-NC-SA 4.0![]()
![]()
![]()
![]()