PATTERNS
zonal operations
Zonal operations analyze pixel values in one layer based on zones (regions) defined by another layer. In Earth Engine, the zones are often (but not always) defined by features in a feature collection.
more soon
zonal area
These methods use the zones defined by the geometry of a feature collection to compute the area of each class in a nominal or boolean layer.
 area of classes
This method returns a dictionary that reports the total area (in square meters) of each class (integer value) in the input raster.
var area_of_classes = geo.iZonal.areaClasses(image, scale, region, "band_name");

print(
    "Area (square meters)",
    area_of_classes
);
The table below describes the arguments.
| ARGUMENT | DESCRIPTION |
|---|---|
| image | The boolean or nominal (class) image to compute the area for each unique pixel value. |
| scale | The pixel scale for analysis to troubleshoot TIME OUT errors. It can be helpful to first run at a coarse resolution and then increase resolution (make number smaller) as appropriate. |
| region | Feature collection with one or more features that define the area of analysis or study region. |
| “band_name” | The band name in the image with the integer values that identify the classes to compute the area of. |
area of classes as percent of region
This method returns a dictionary that reports the total area of each class (integer value) in the input raster as a percent of the region. It takes the output from .areaClasses() (above) as the input and returns a dictionary.
var class_percent_of_region = geo.iZonal.classPercentRegion(area_of_classes);

print(
  "Area (percent of region)",
  class_percent_of_region
  )
;
complete pattern
Here is the complete pattern for calculating the area of raster classes and their percent area of a region.
var area_of_classes = geo.iZonal.areaClasses(image, scale, region, "band_name");

print(
    "Area (square meters)",
    area_of_classes
);

var class_percent_of_region = geo.iZonal.classPercentRegion(area_of_classes);

print(
  "Area (percent of region)",
  class_percent_of_region
  )
;
zonal statistics
This method calculates a statistic of image values within a zone of analysis defined by one or more features in a feature collection. The output of the method is a feature collection with a new column that contains the statistic.
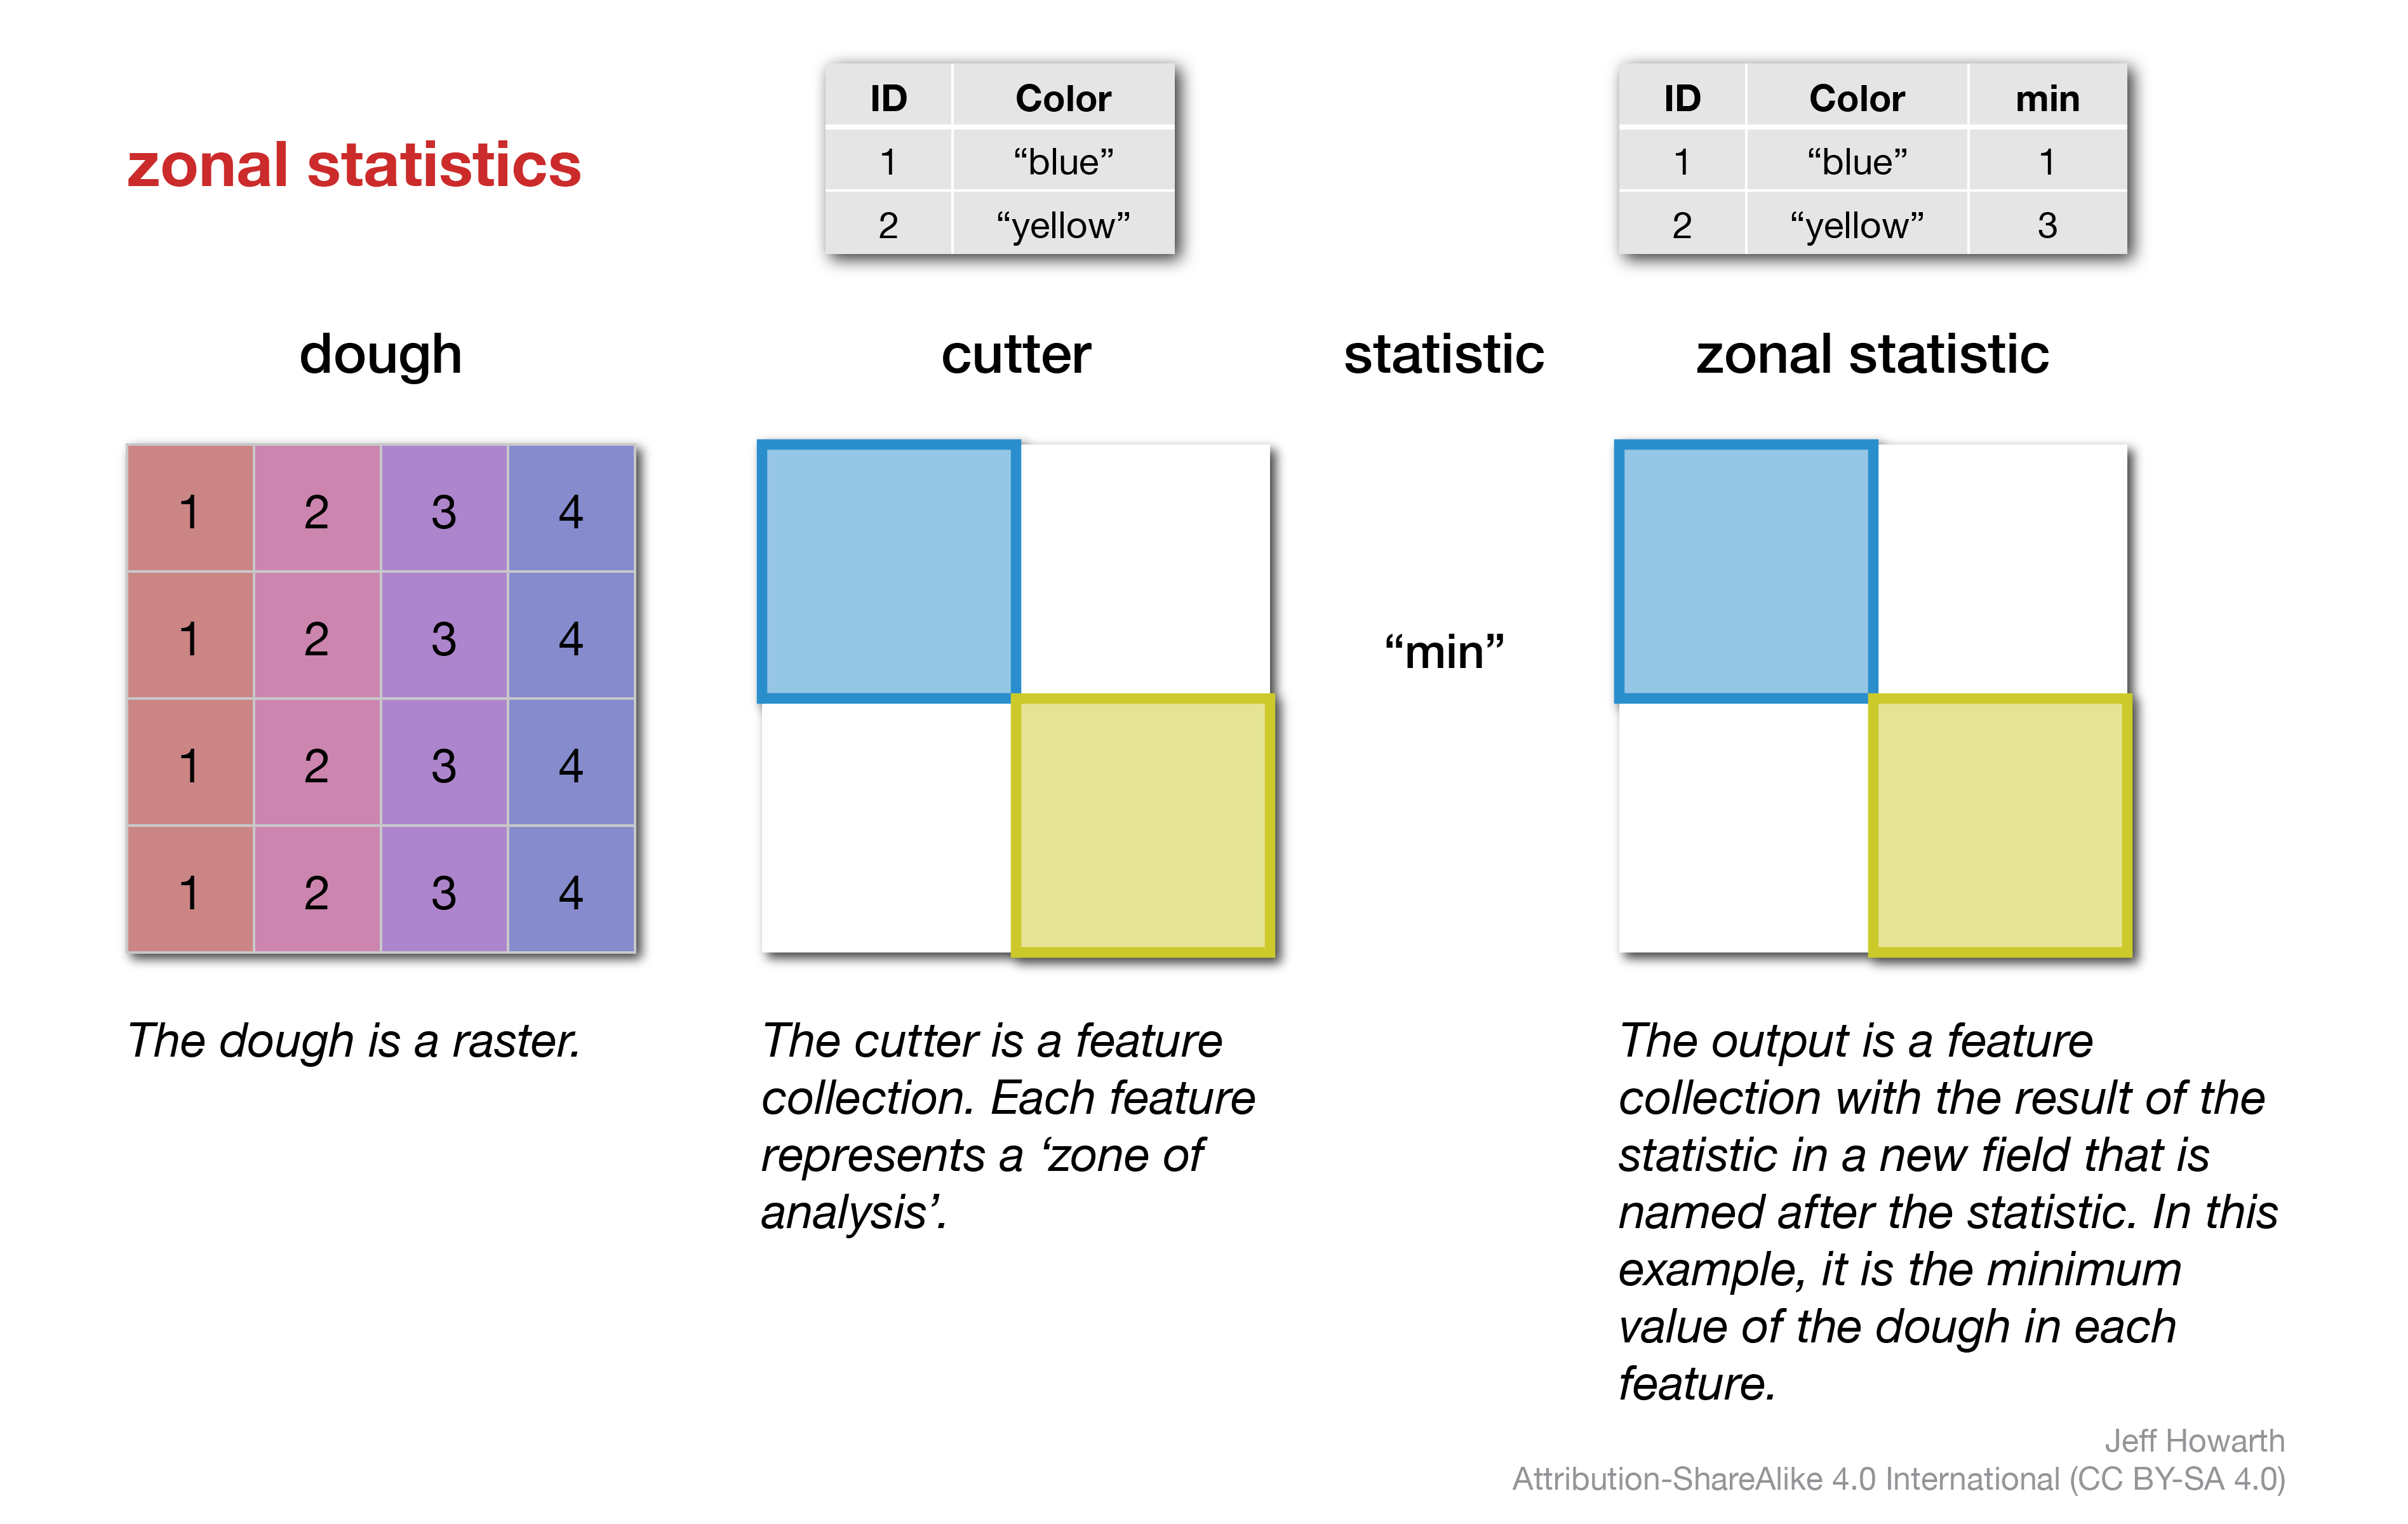
var fc_zonal_stat = geo.iZonal.zonalStats(dough, cutter, "statistic", scale);
The method takes four arguments that are defined in the table below.
| ARGUMENTS | DESCRIPTION |
|---|---|
| dough | The image with pixel values to be analyzed. |
| cutter | The feature collection with one or more features that define the zones of analysis. |
| “statistic” | The statistic to calculate within each zone of analysis. Must be a string from these options: “sum”, “max”, “min”, “mean”, “count”, “variety” (“count” reports the number of pixels, while “variety” reports the number of unique pixel values). |
| scale | The scale of analysis. Should be set to raster scale (pixel size) of dough. If you encounter time out errors that prevent you from displaying output layer, you can try to resolve by changing the scale of analysis, though this will introduce rounding errors. |
clip by region
This is a knife method that will use the zones of a feature collection to clip a raster. The result is similar to a mask operation, but here you use a vector dataset to cut rather than a raster dataset. The engineers at Google warn that .clip() is more computationally expensive than .updateMask() and can be particularly slow with complex geometries.
var output_clip = input.clip(cutter);
chart zonal statistic by class
This pattern calculates a zonal static where (1) a nominal (classified, categorical, object) image defines the cutter (rather than a feature collection) and (2) the output is a chart (rather than a feature collection).
As a method for calculating zonal statistics, the underlying spatial concept is to use one layer (the cutter image) to define zones for statistical analysis of a dough image. Because the output is a chart, there are a few more inputs, so you will need to fill out a dictionary to use the method.
// ---------------------------------------------------------------------
//  Chart a zonal statistic with a class layer.
// ---------------------------------------------------------------------

// Define chart arguments.

var chart_arguments = {
  data_image: dough_image,
  class_image: cutter_image,
  aoi: area_or_interest,
  reducer: statistic,
  scale: analysis_scale,
  title: chart_title,
  class_labels: labels_that_define_cutters,
  palette: palette_for_cutters,
  ha_label: label_for_horizontal_axis


};

var myChart = geo.uiChart.makeBarChartByClass(chart_arguments);
The table below defines each key in the dictionary and describes rules of thumb.
| ARGUMENT | DESCRIPTION |
|---|---|
| data_image | The dough image; a numeric image with values that you would like to summarize with a statistic. |
| class_image | The cutter image; an image with values that represent names or categories or classes, that you would like to use as zones of analysis. |
| aoi | A feature collection that defines an area of interest or study region. |
| reducer | The statistic that you would like to calculate within each cutter. Some common options are: ee.Reducer.mean(), ee.Reducer.median(), ee.Reducer.min(), ee.Reducer.max() |
| scale | The scale of analysis. Ideally, set to be the same resolution as your dough image. If you encounter TIME OUT errors, try to coarsen the scale. |
| class_labels | Names for the cutters in your class image. Must be a list of strings, where each string in the list defines a class. Ideally, you have one label per class value. The order of the labels in your list should match the order of the class values. This is similar to the labels of a nominal legend. |
| title | The title for the chart. Must be a string. |
| palette | The colors for each class in the chart. Must be a list of strings, where each string defines an html color. The length of this list should match the length of the class label list. This is similar to the palette of a nominal legend. |
| ha_label | A title for the horizontal axis of the chart. Must be a string. |
This work is licensed under CC BY-NC-SA 4.0![]()
![]()
![]()
![]()