PRACTICE 6
Changes in the night
goal
This problem aims to introduce you to making and interpreting RGB composites with additive color.
Your practiceal goal is to make a map that shows changes in the brightness of nighttime lights between 1993, 2003, and 2013. You will then interpret the additive colors in the image to describe different patterns of change.
Your solution should make a map like that shown in the app below.
conceptual workflow
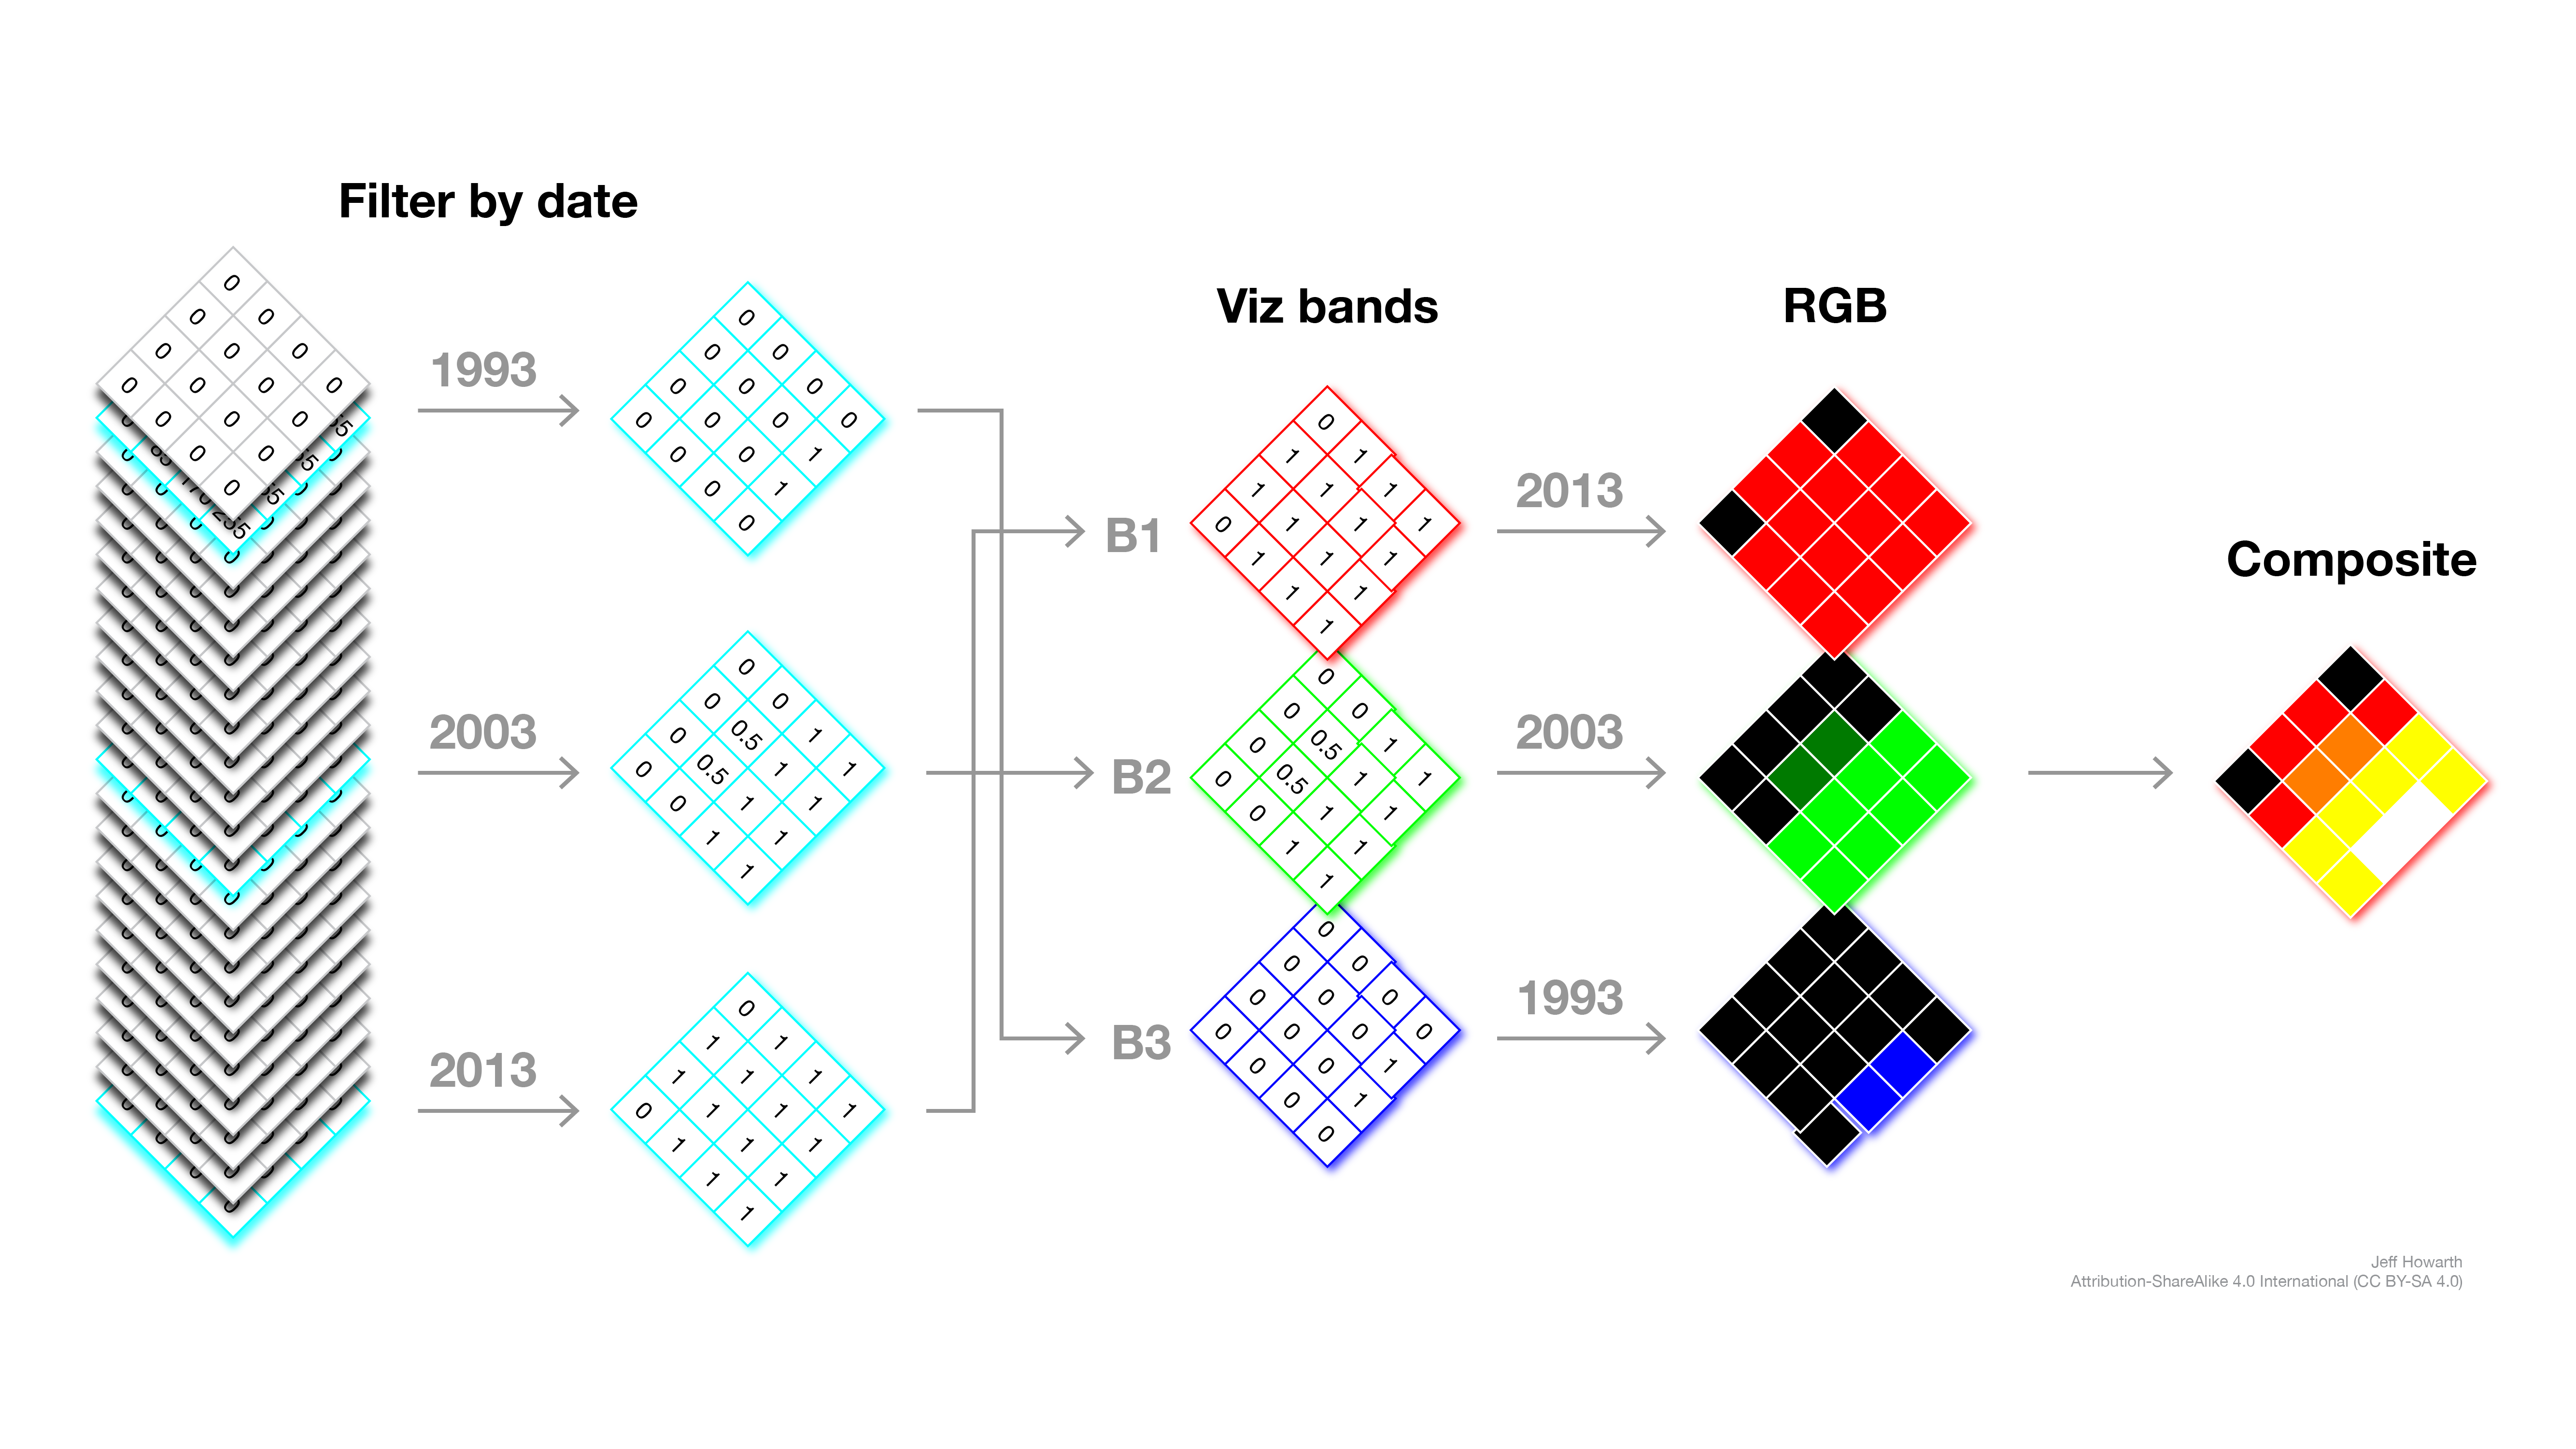
The diagram below sketches how we will use additive color to show changes in a nighttime lights dataset with Earth Engine.

starter workflow
00 start a new script
/*
// ><><><><><><><><><><><><><><><><><><><><><><><><><><><><><><><

    AUTHOR:
    DATE:
    TITLE:    P6: Changes in the night

// ><><><><><><><><><><><><><><><><><><><><><><><><><><><><><><><
*/

var geo = require("users/jhowarth/eePatterns:modules/geo.js");

print("geo methods dictionary", geo.help);    // Prints dictionary of all tools in module.
print("geo palettes", geo.iPalettes);         // Prints dictionary of all palettes in module.
01 set up map and AOI
// -------------------------------------------------------------
//  Set up Map.
// -------------------------------------------------------------

Map.setCenter(126.8, 33.485, 5);
Map.setOptions('HYBRID');

// Get AOI from Map extent
02 gather image collection
Please use this dataset and band:
var ic_address = 'NOAA/DMSP-OLS/NIGHTTIME_LIGHTS';
var band = "stable_lights";
// -------------------------------------------------------------
//  Gather image collection
// -------------------------------------------------------------


// -------------------------------------------------------------
//  Select "stable lights" band from image.
// -------------------------------------------------------------
03 filter by time
Please filter the collection for images captured in the years 2013.
// -------------------------------------------------------------
//  Filter image collection by calendar unit.
// -------------------------------------------------------------
04 select image, rename band
// -------------------------------------------------------------
//  Select first image of collection.
// -------------------------------------------------------------


// -------------------------------------------------------------
//  Rename band "2013".
// -------------------------------------------------------------
05 display image as Map layer
// -------------------------------------------------------------
//  Display image as Map layer.
// -------------------------------------------------------------
06 make mean image for 2003
Please recycle the steps above to make an image that represents the mean brightness of nighttime lights in the year 2003.
Why do you think we need to make a composite image here, rather than just selecting the first image in the filtered collection?
// -------------------------------------------------------------
//  Filter collection for year 2003
// -------------------------------------------------------------


// -------------------------------------------------------------
//  Composite collection by mean
// -------------------------------------------------------------


// -------------------------------------------------------------
//  Rename image band.
// -------------------------------------------------------------


// -----------------------------------------------------------------------
//  Display image as layer on the map.
// -----------------------------------------------------------------------
07 make mean image for 2013
Now try to chain the workflow, rather than saving each step as a separate variable.
// -----------------------------------------------------------------------
//  Chain the workflow to make the third band.
// -----------------------------------------------------------------------

var select_by_time_3 = select_by_band.filter(
  ee.Filter.calendarRange(1993, 1993, "year")
  )
  .mean()
  .rename(["1993"])
;

// print("Year 3", select_by_time_3);

Map.addLayer(select_by_time_3, viz, "1993", false);


// -----------------------------------------------------------------------
//  Construct a three band image from the three images.
// -----------------------------------------------------------------------


// -----------------------------------------------------------------------
//  Add RGB composite as a layer to the map.
// -----------------------------------------------------------------------
08 explore the RGB image
Please copy and paste this code to the end of your script. You will need to replace “change_image” with the name of your three band image that represents nighttime lights in 2013, 2003, and 1993.
Then run your script, explore the five patterns, and click locations to make charts of data values. What do the different visual patterns (Flame, Aurora, Holiday Lights, Red Giant, Political lines) show you about the temporal characteristics of spatial change?
When you have finished exploring the image, please complete the [practice-06 checkup] link coming soon on Canvas by Friday 10/25 @ 5pm .
// -----------------------------------------------------------------------
//  Widgets
// -----------------------------------------------------------------------

//  Please uncomment the line below and run the script.

geo.uiWidgets.p6(change_image);
This work is licensed under CC BY-NC-SA 4.0