STARTERS
Sentinel
Earth Engine provides a number of different Sentinel products as cloud assets.
Sentinel-2 MSI
The starter below will help you quickly find and process Level 1-C Harmonized Surface Reflectance data from the Sentinel 2 Multispectral Instrument (MSI).
prereqs
To thoughtfully use the starter script below, you should be able to answer these questions:
- what is surface reflectance and how does this differ from other Sentinel products available through Earth Engine catalog?
- why is harmonized data helpful for time series analysis?
- what is the mission duration (start and end of image collection)?
- what is the recurrence time of each scene (how may days between images)?
- how does the satellite orbit affect the time difference between neighboring scenes?
- what time of day is the scene captured as an image?
- what portion of the EM spectrum does each band measure?
- what is the spatial resolution of each band?
You can glean much of this info from these resources:
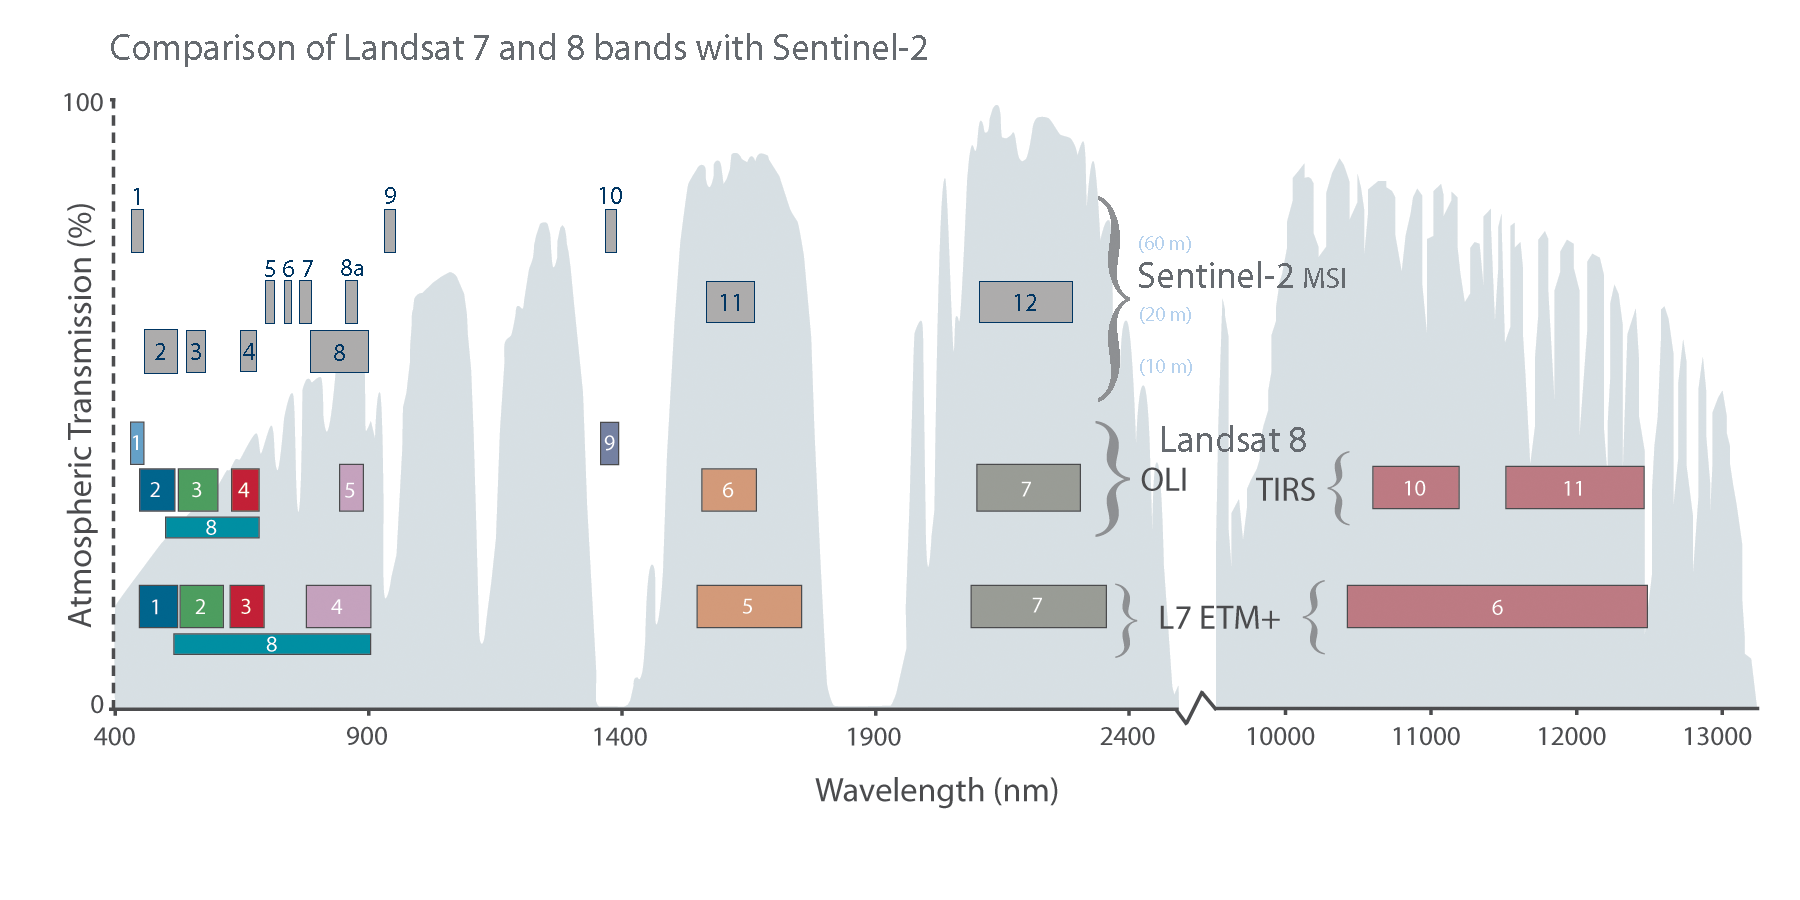
spectral bands
The chart below shows how the MSI sensor on Sentinel compares to the sensors onboard the Landsat missions.

starter
//  ~~~~~~~~~~~~~~~~~~~~~~~~~~~~~~~~~~~~~~~~~~~~~~~~~~~~~~~~~~~~~~~~~~~~~~~
//  Title:        starter_S2.js
//  Author:       Jeff Howarth
//  Last edited:  11/12/2023
//
//  Starter for harmonized Sentinel 2 collection.
//  ~~~~~~~~~~~~~~~~~~~~~~~~~~~~~~~~~~~~~~~~~~~~~~~~~~~~~~~~~~~~~~~~~~~~~~~

var geo = require("users/jhowarth/eePatterns:modules/geo.js");

print("geo methods dictionary", geo.help);    // Prints dictionary of all tools in module.
print("geo palettes", geo.iPalettes);         // Prints dictionary of all palettes in module.

// ----------------------------------------------------------------------
//  Define your point or area of interest with geometry tools.
// ----------------------------------------------------------------------

var geometry =
    ee.Geometry.Point([37.34715255366928, -3.0521293499524087]);

Map.centerObject(geometry, 9);

// ----------------------------------------------------------------------
//  Filter and flatten image collection.
// ----------------------------------------------------------------------

var output = ee.ImageCollection("COPERNICUS/S2_SR_HARMONIZED")
  .filterBounds(geometry)
  // .filter(ee.Filter.calendarRange(2020, 2020, 'year'))
  .filter(ee.Filter.calendarRange(1, 3, 'month'))
  // .filter(ee.Filter.calendarRange(1, 30, 'day'))
  .filter(ee.Filter.lt('CLOUDY_PIXEL_PERCENTAGE',20))
  .map(geo.icSentinel.cloudMask_S2)
  .map(geo.icSentinel.scale_S2)
  .median()
;

print(output);

// ----------------------------------------------------------------------
//  Display layer on Map.
// ----------------------------------------------------------------------

// Print list of band names for S2.

print(
  "S2 BAND LIST",
  geo.icSentinel.bands_S2
);

// Define viz parameters.

var viz = {
  bands: ['B4', 'B3', 'B2'],
  min: [0, 0, 0],
  max: [0.2, 0.15, 0.1]
};

// Add layer to Map.

Map.addLayer(output, viz, 'From Sentinel 2 Collection');

// ------------------------------------------------------------------------
//  Chart histogram for a selected Image band.
// ------------------------------------------------------------------------

// Select a band in viz dictionary to chart.

var select_band = output.select(viz.bands[0]);

// Get AOI from map extent.

var aoi = geo.uiMap.getAOIfromMapExtent();

// Get scale from map extent.

var scale =  Map.getScale();

// Make and print histogram.

var histogram = geo.iCart.iHistogram(
    select_band,
    scale,
    aoi
);

print("Histogram of selected band", histogram);
This work is licensed under CC BY-NC-SA 4.0