Fire scars
Key terms
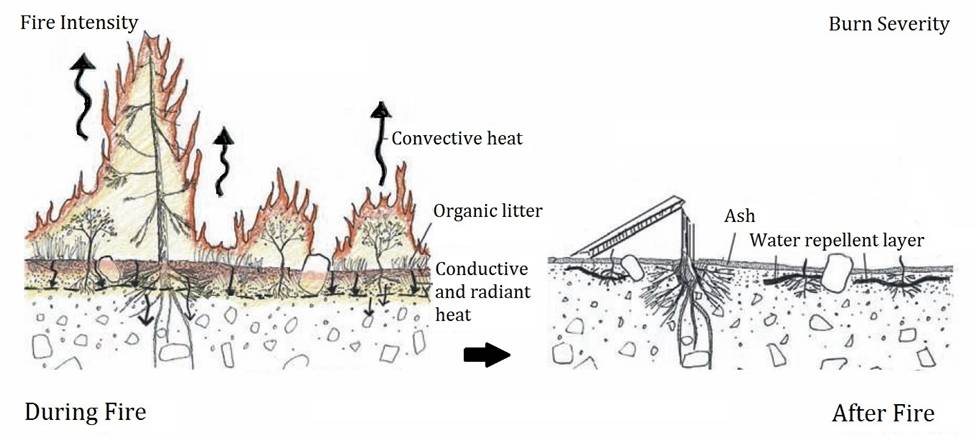
- Fire intensity: intensity of fire while active
- Burn severity: degree to which fire alters an area
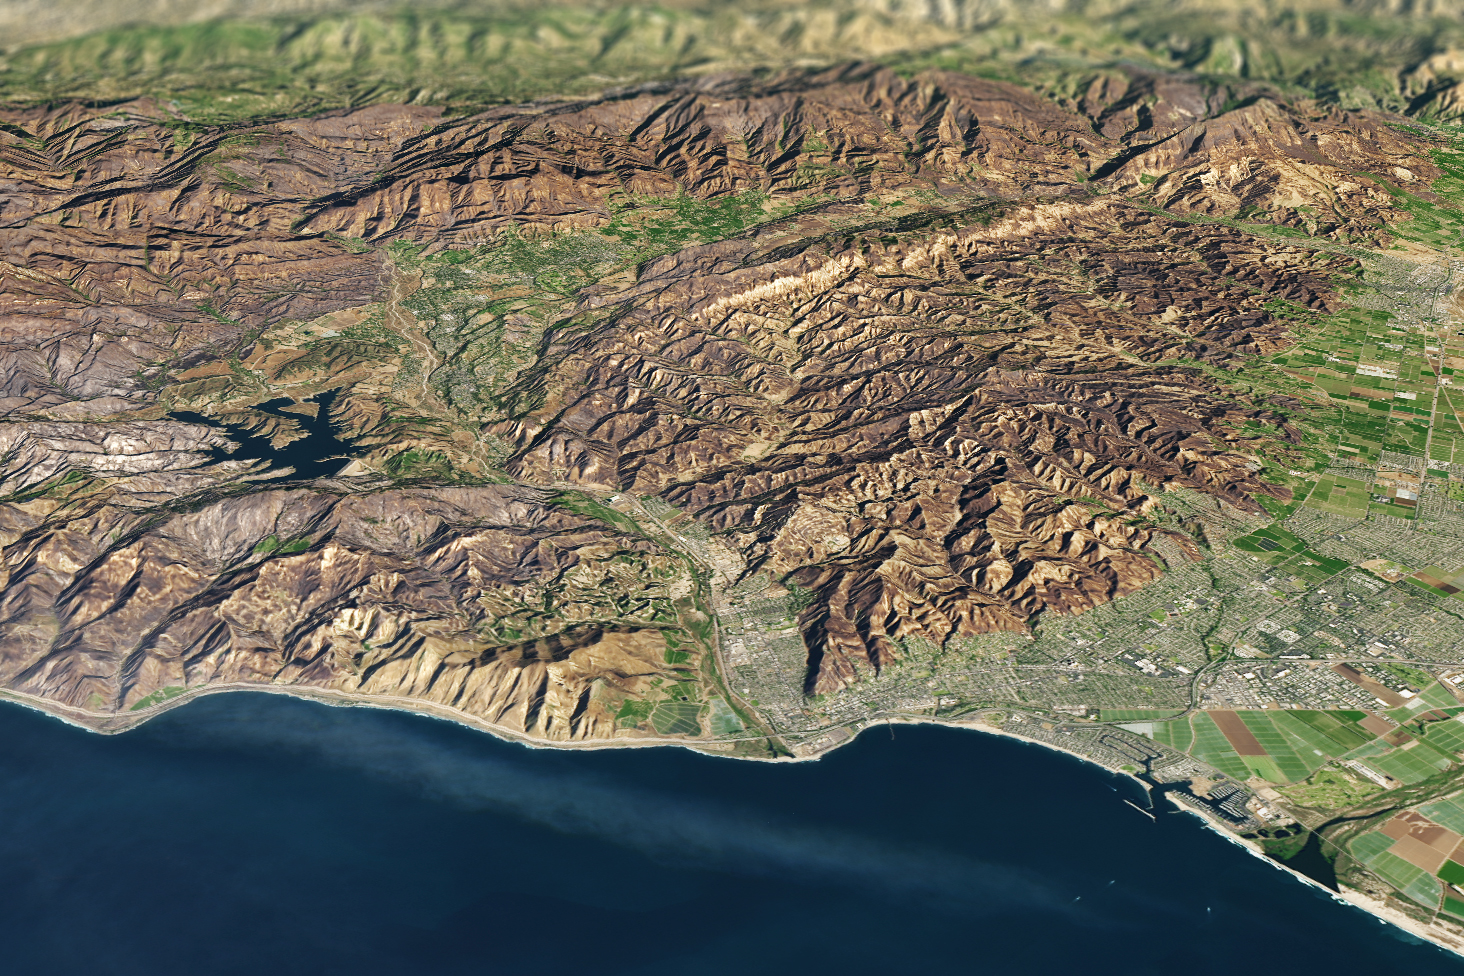
Fire scars
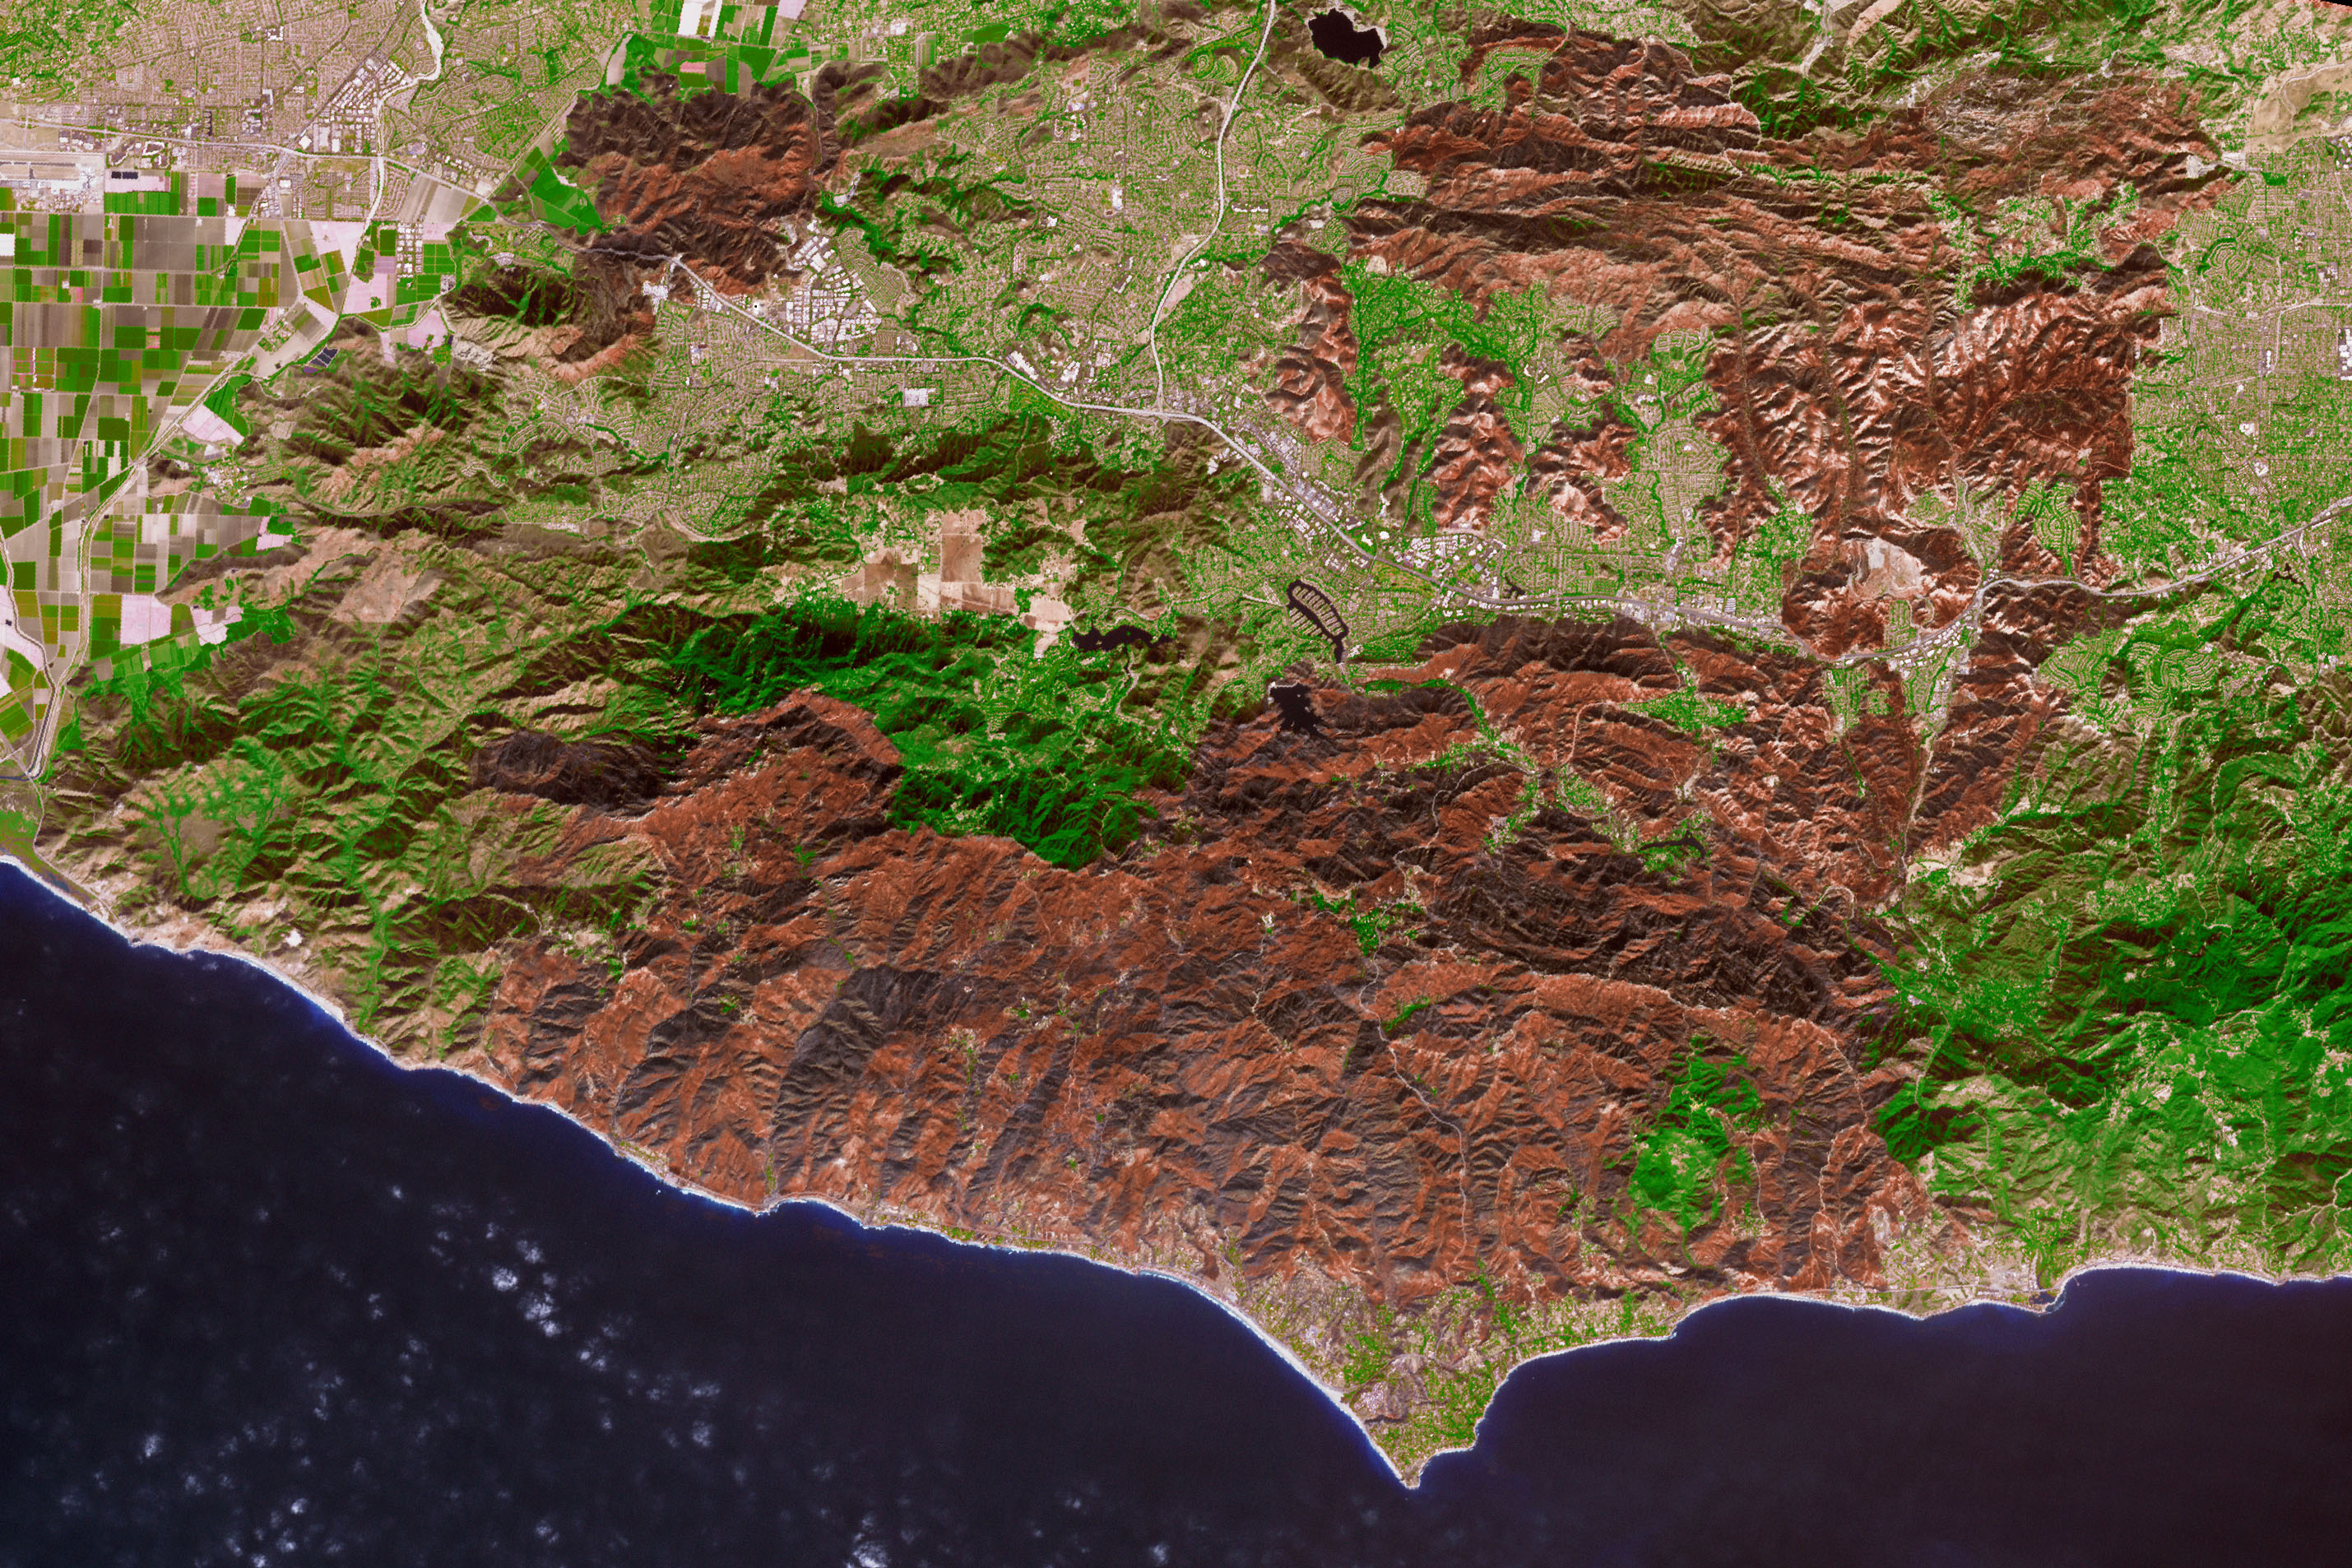
Here are a few examples of false color composites that show fire scars on a landscape.
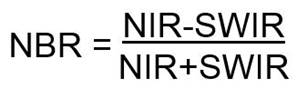
Normalized Burn Rato
The images above all use data in three bands to show scars with additive color. In order to document a fire scar with a single band, we can compute a normalized band ratio.
= Band A - Band B / Band A + Band B
For fire scars, the normalized burn ratio works with the NIR and SWIR2 bands for Band A and Band B, respectively.
To understand how this works, we need to consider the spectral signatures of health vegetation versus bare ground.
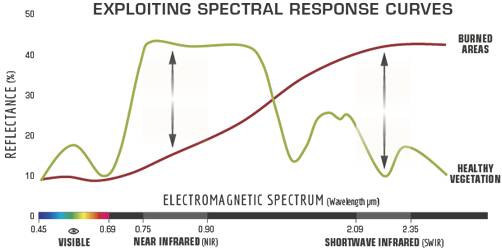
A high NBR indicates healthy vegetation while a low NBR value indicates bare ground and recently burnt areas.
Burn severity
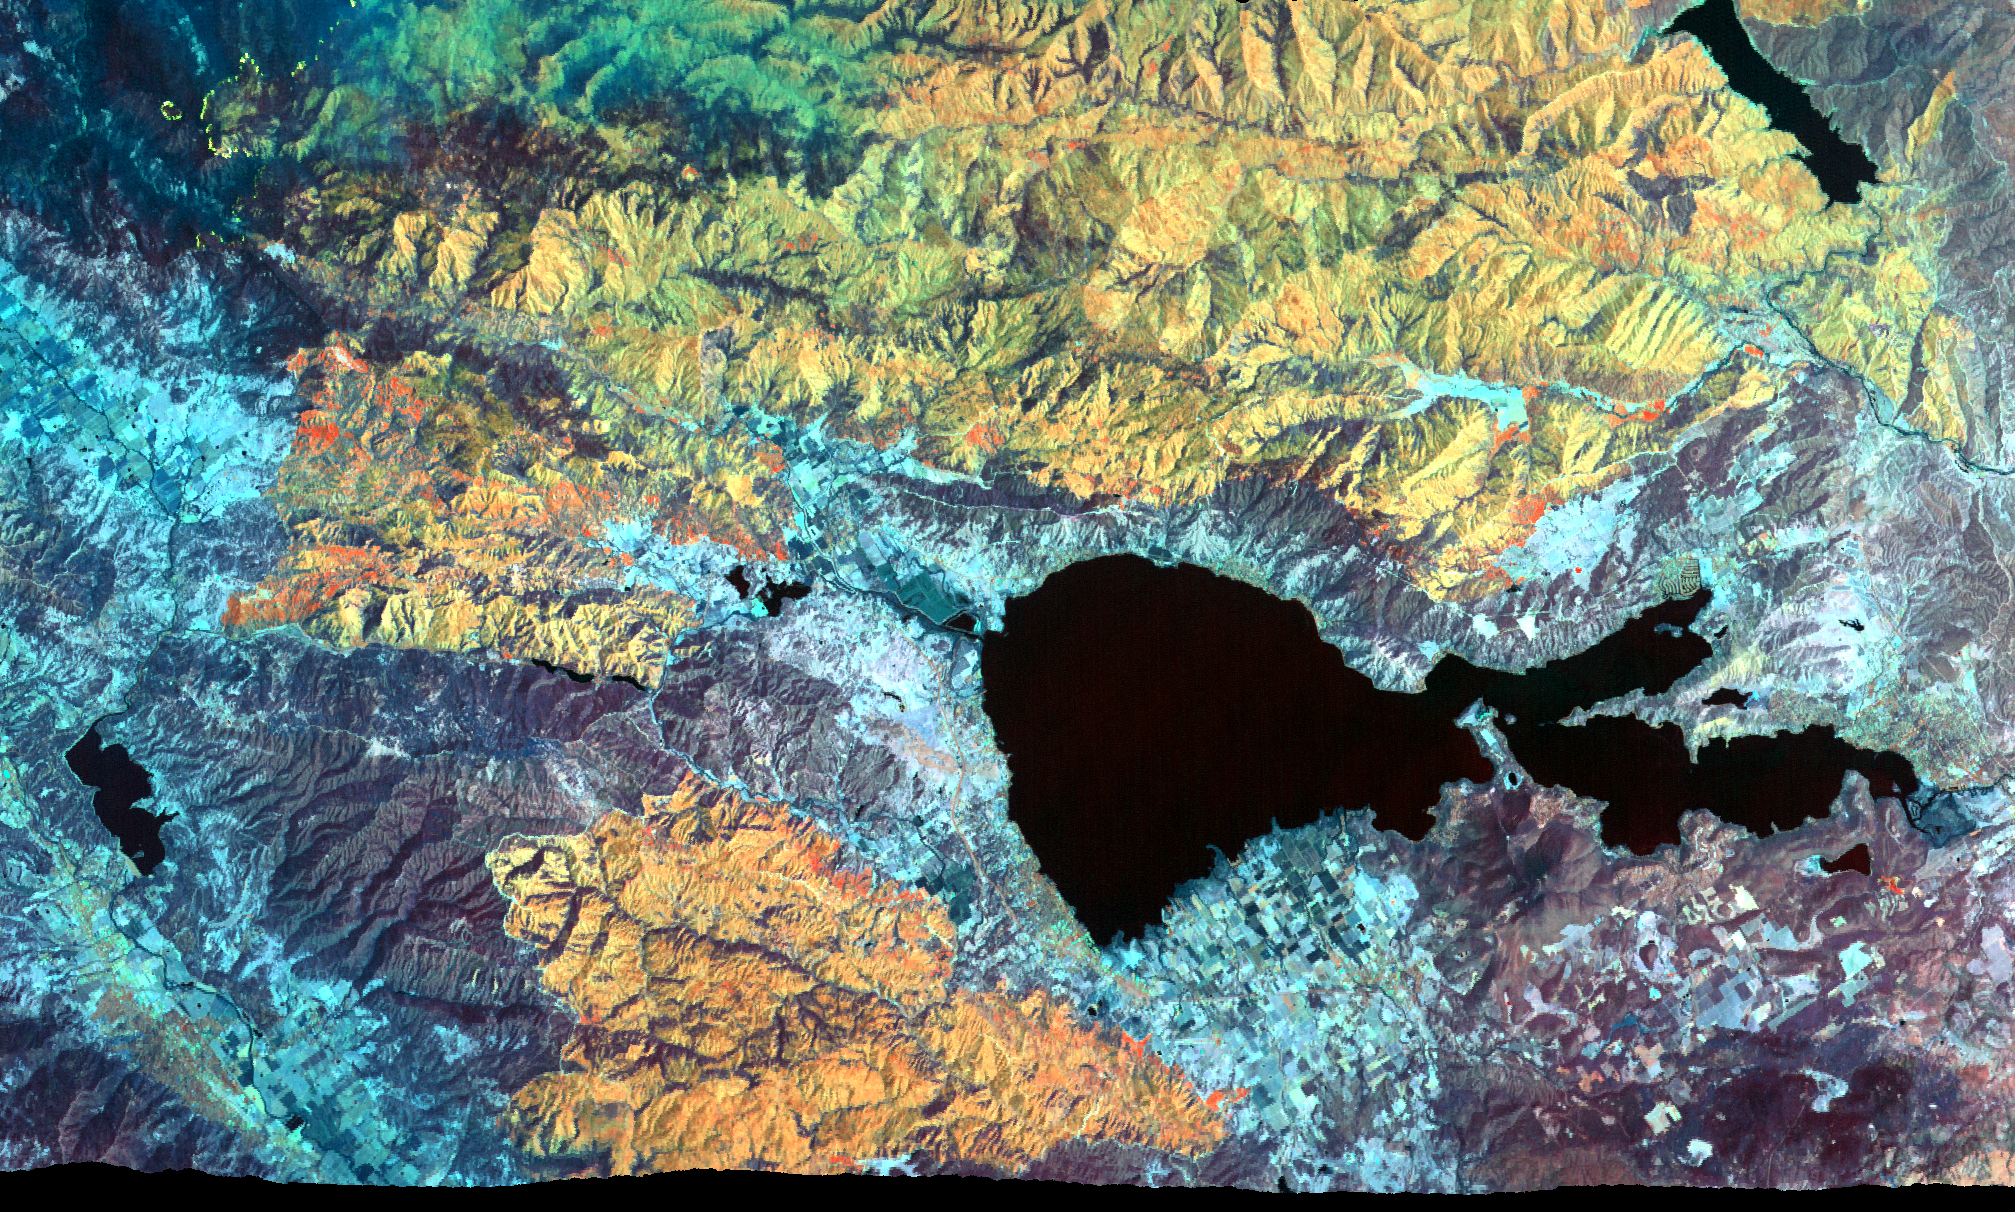
We can then compare the normalized burn ratio following a fire to the normalized burn ratio of the same season prior to the fire. The difference in the two ratios represents a measure of the burn severity.

Here is an example for two lightning complex fires in California.
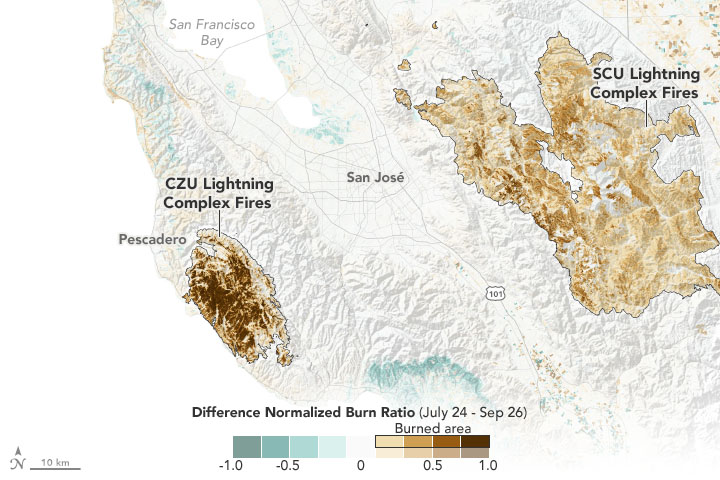
Assessing California Fire Scars
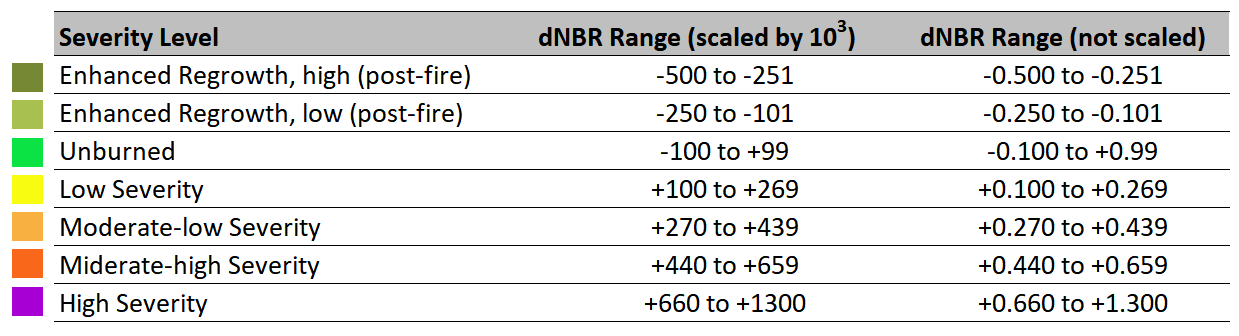
Severity classes
Although the real-world impacts of this burn severity index likely varies geographically, the US Geological Survey uses a standard classification scheme to help fire managers compare the impacts of fire across space and over time.