In Natural and False Color
Introduction
A remote sensing system observes conditions on Earth (or other planets) without making direct contact with the observed subject. This generally involves a sensor (typically onboard a vehicle) and a ground station (that receives data from the vehicle).
Some systems passively observe conditions by measuring energy that is generated by another source, while others emit energy in some form and measure how it returns.

source: Arkarjun (2013)
Today we will focus on passive systems and try to better understand what they measure and how we can use additive color to see things in imagery that we cannot see in the real world.
Electromagnetic Spectrum
The electromagnetic spectrum describes the range of energy wavelengths in sunlight.
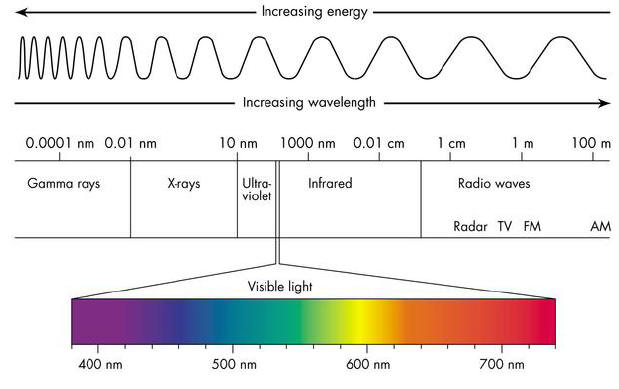
source: serc.carleton.edu
Spectral Bands of Sensors
A sensor onboard a vehicle will be able to measure the amount of energy that it receives in different spectral bands, or portions of the EM spectrum.
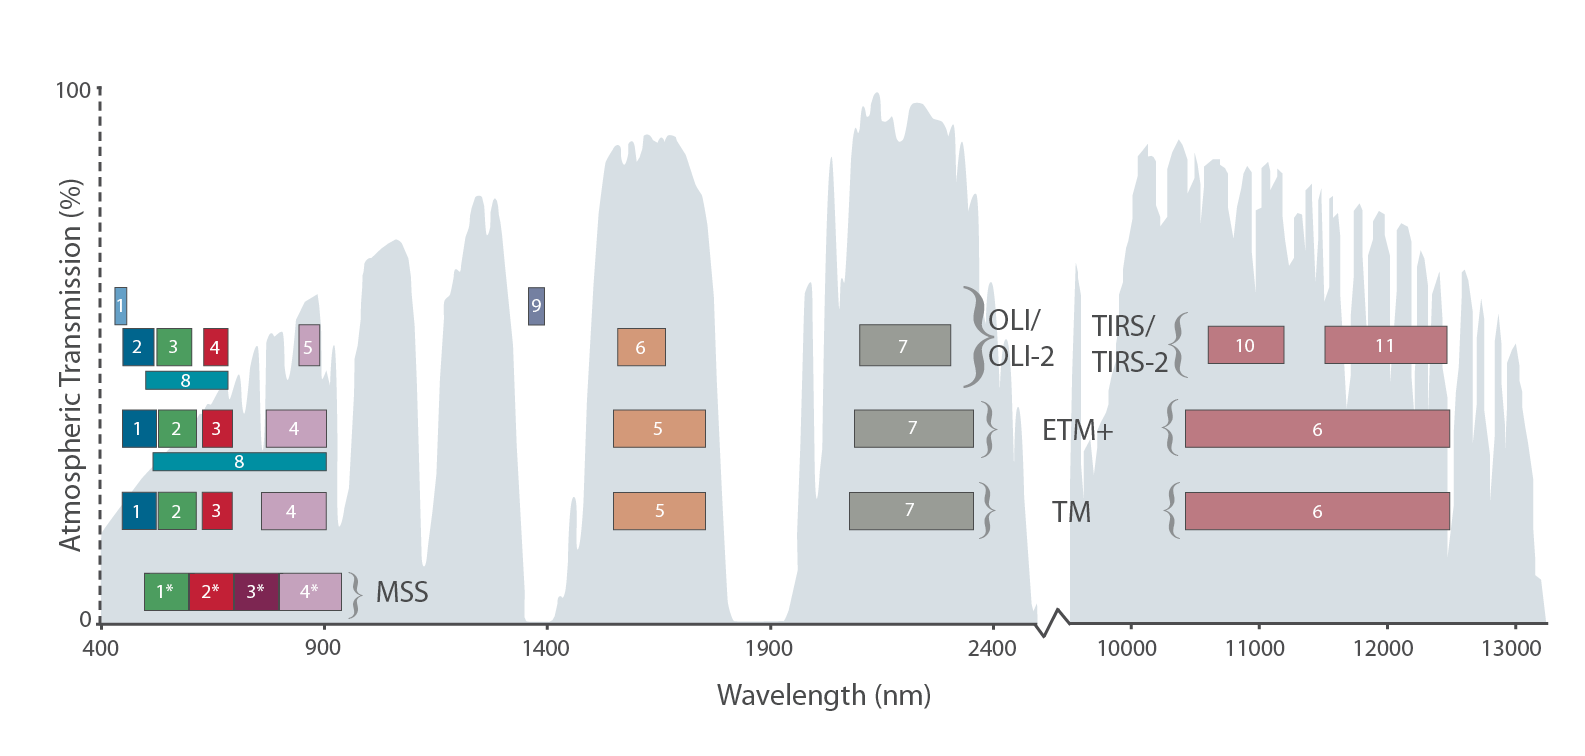
| Acronym | Name |
|---|---|
| MSS | Multispectral Scanner |
| TM | Thematic Mapper |
| ETM+ | Enhanced Thematic Mapper |
| OLI/OLI-2 | Operational Land Imager |
| TIRS/TIRS-2 | Thermal Infrared Sensor |
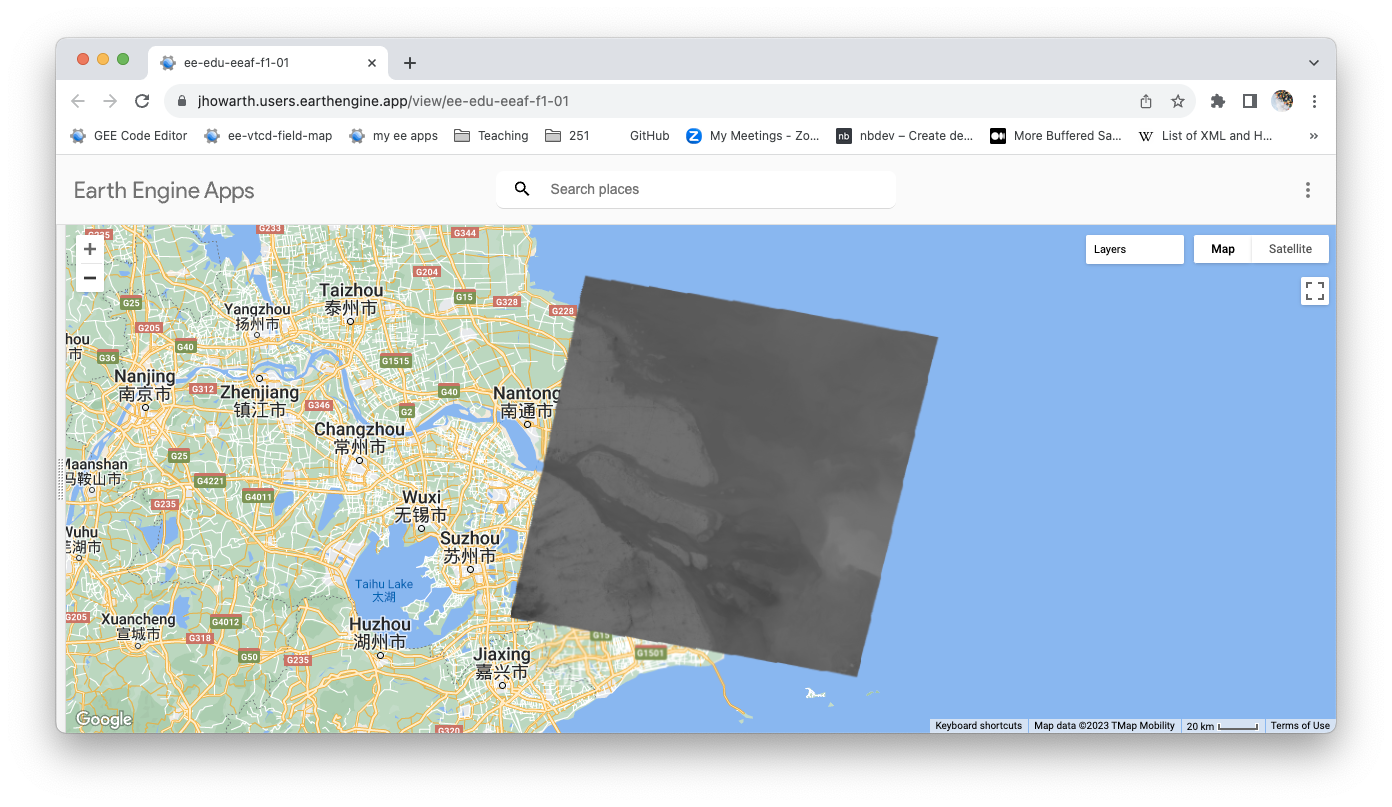
Bands
Each band captures the amount of energy at each pixel. The picture below shows the pixel values of an individual band that are displayed with a grayscale (black to white) palette.
Stretch enhancement
The image above looks a little drab because we are not using our display values very efficiently. We can improve the contrast of this image with stretch enhancement.
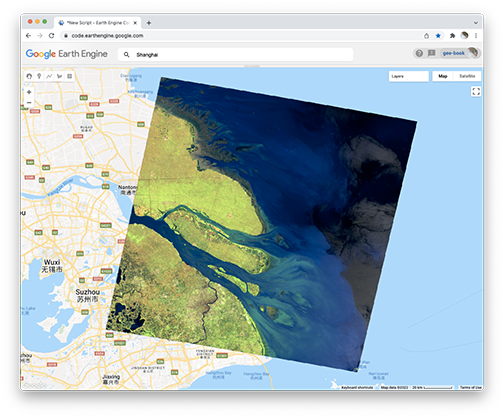
Natural color
Now we can take advantage of additive color and display the bands that report the amount of energy in the red, green, and blue portions of the EM spectrum with the red, green, and blue color channels. The result is called a natural color composite because it looks natural to human eyes, or similar to the world that we experience, or at least it looks like the world that we can see from an airplane window.
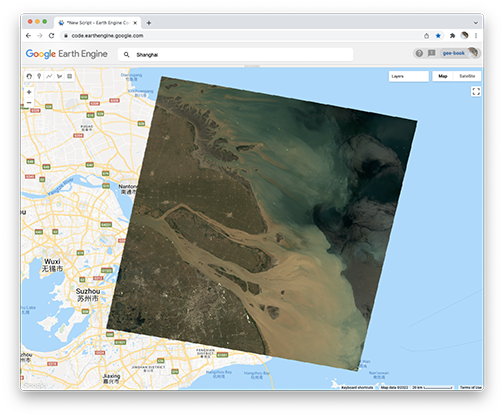
In a natural color composite, we use a straight mapping between the EM band and the display color channel.
| Band | Color Channel |
|---|---|
| Red | Red |
| Green | Green |
| Blue | Blue |
False color
The remote sensing instruments onboard satellites will often report data in portions of the EM spectrum that we cannot see. When we use additive color to visualize energy that we cannot otherwise see, the results are called false color composites. The picture below shows a NIR false color.
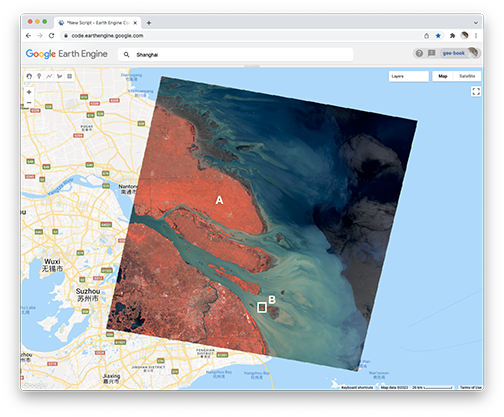
So now the colors are false and this can be a little weird to think through, but the main point is to remember that we can use different colors to display different ranges of the EM spectrum (even though we naturally see some of these ranges as color).
| Band | Color Channel |
|---|---|
| NIR | Red |
| Red | Green |
| Green | Blue |
There are a lot of different false color composites that you can make with additive color. For example, here is another common false color composite that displays shortwave energy.
| Band | Color Channel |
|---|---|
| SWIR2 | Red |
| NIR | Green |
| Green | Blue |
Make some composites
Go ahead and try to make the color composites shown above and use stretch enhancement to improve the contrast of each image.
As a guide for exploring color composites, here is a very helpful resource that identifies useful band combinations for different thematic applications in environmental science and geography.
What do the colors mean?
Spectral signature charts show how reflectance changes with wavelength for different land cover types.

source: Hartley Bulcock
We can explore spectral signature with this app.
Summary
Remote sensing involves capturing data about a place without being in contact with the place. We capture this data with sensors onboard vehicles, like satellites, drones, and airplanes. These sensors measure the amount of energy that reflects or radiates from the Earth, storing this data in each pixel of a raster dataset. Most sensors capture this data within specific ranges of the electromagnetic spectrum, which are called spectral bands; this includes both visible and non-visible portions of the spectrum. We can use additive color to display the values of three spectral bands at once and we can use stretch enhancement to improve the contrast of the resulting images. The color composites that result help us visualize three slices of the spectral signatures of land cover. We can also use the spectral signatures of land cover to help guide our choice of band combinations to make color composites.

This work is licensed under a Creative Commons Attribution-NonCommercial-NoDerivs 4.0 International License.