Basic Image Collections
Introduction
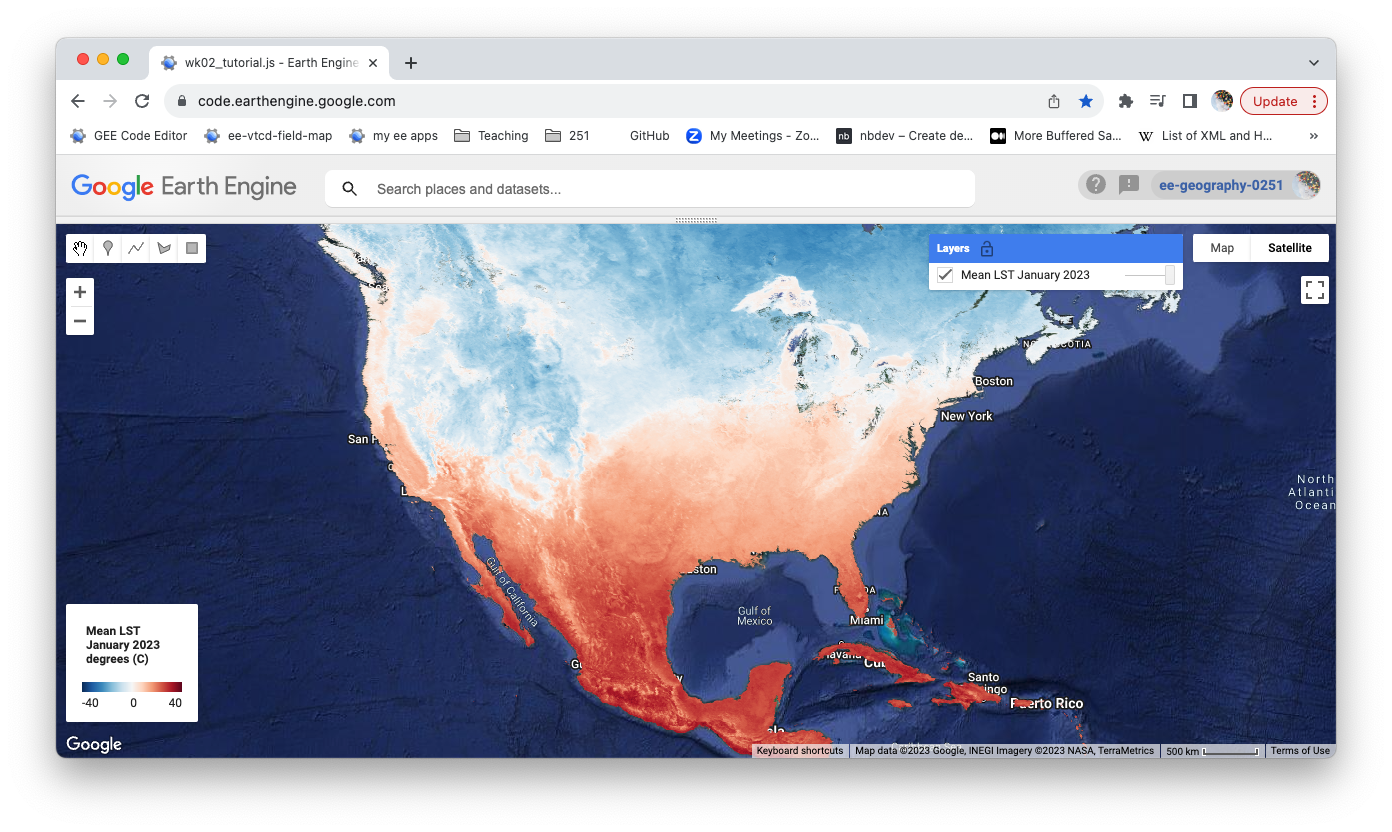
This tutorial introduces a common workflow for processing and visualizing image collections with Earth Engine. You will use a MODIS Land Surface Temperature product to make a map that shows the mean LST for January 2023 in degrees Celsius. By the end of the tutorial, you should have a map that looks like the image below.
Start a new script
//  ~~~~~~~~~~~~~~~~~~~~~~~~~~~~~~~~~~~~~~~~~~~~~~~~~~~~~~~~~~~~~~~
//  TITLE:      wk02_tutorial.js
//  AUTHOR:     your name
//  DATE:       today's date
//  PURPOSE:    A basic workflow for processing image collections.
//  ~~~~~~~~~~~~~~~~~~~~~~~~~~~~~~~~~~~~~~~~~~~~~~~~~~~~~~~~~~~~~~~

// Load check module.

var check = require('users/jhowarth/eePrimer:modules/checks.js');

// ----------------------------------------------------------------
//  Process the image collection.
// ----------------------------------------------------------------
Load image collection
// Step 1: Load image collection

var step_1 = ee.ImageCollection();
Filter by date
// Step 2: Filter image collection by date.

var step_2 = step_1.filter(ee.Filter.date());
Select band
// Step 3: Select band.

var step_3 = step_2.select();
Reduce to image
// Step 4: Reduce image collection.

var step_4 = step_3;
Scale data (if necessary)
// Step 5: Apply scalar (if EE data catalog tells you the data are scaled).

var step_5 = step_4;
Convert units (if necessary)
// Step 6: Convert units (if units need conversion).

var step_6 = step_5;
Visualize results as layer
// ----------------------------------------------------------------
//  Visualize results as layer.
// ----------------------------------------------------------------

//  Set base map.


//  Load community palettes.

var palettes = require('users/gena/packages:palettes');

// print('Community palettes', palettes);

//  Define visualization parameters.

// var viz = {
//   bands: ,
//   min: ,
//   max: ,
//   palette: palettes.colorbrewer.RdBu[11]
// };

//  Display the data values with the visualization parameters.

// Map.addLayer();
Add a legend
// ---------------------------------------------------------------------
//  Add a legend.
// ---------------------------------------------------------------------

//  Load cart module.

var cart = require('users/jhowarth/eePrimer:modules/cart.js');

// Call makeGradientLegend function and pass three parameters.

var legend = cart                                           // module
  .makeGradientLegend(                                      // function
    viz,                                                    // viz parameters
    'degrees (C)',                                          // a label for legend
    'bottom-left'                                           // position on map
  )
;

// Add legend to map.

// Map.add();

This work is licensed under a Creative Commons Attribution-NonCommercial-NoDerivs 4.0 International License.