Changes in the Night
Introduction
This tutorial walks you through how to construct an RGB composite that visualizes change in the DMSP/OLS dataset between 1993 and 2013 like the image shown in the additive color chapter.
The diagram below illustrates the general workflow.
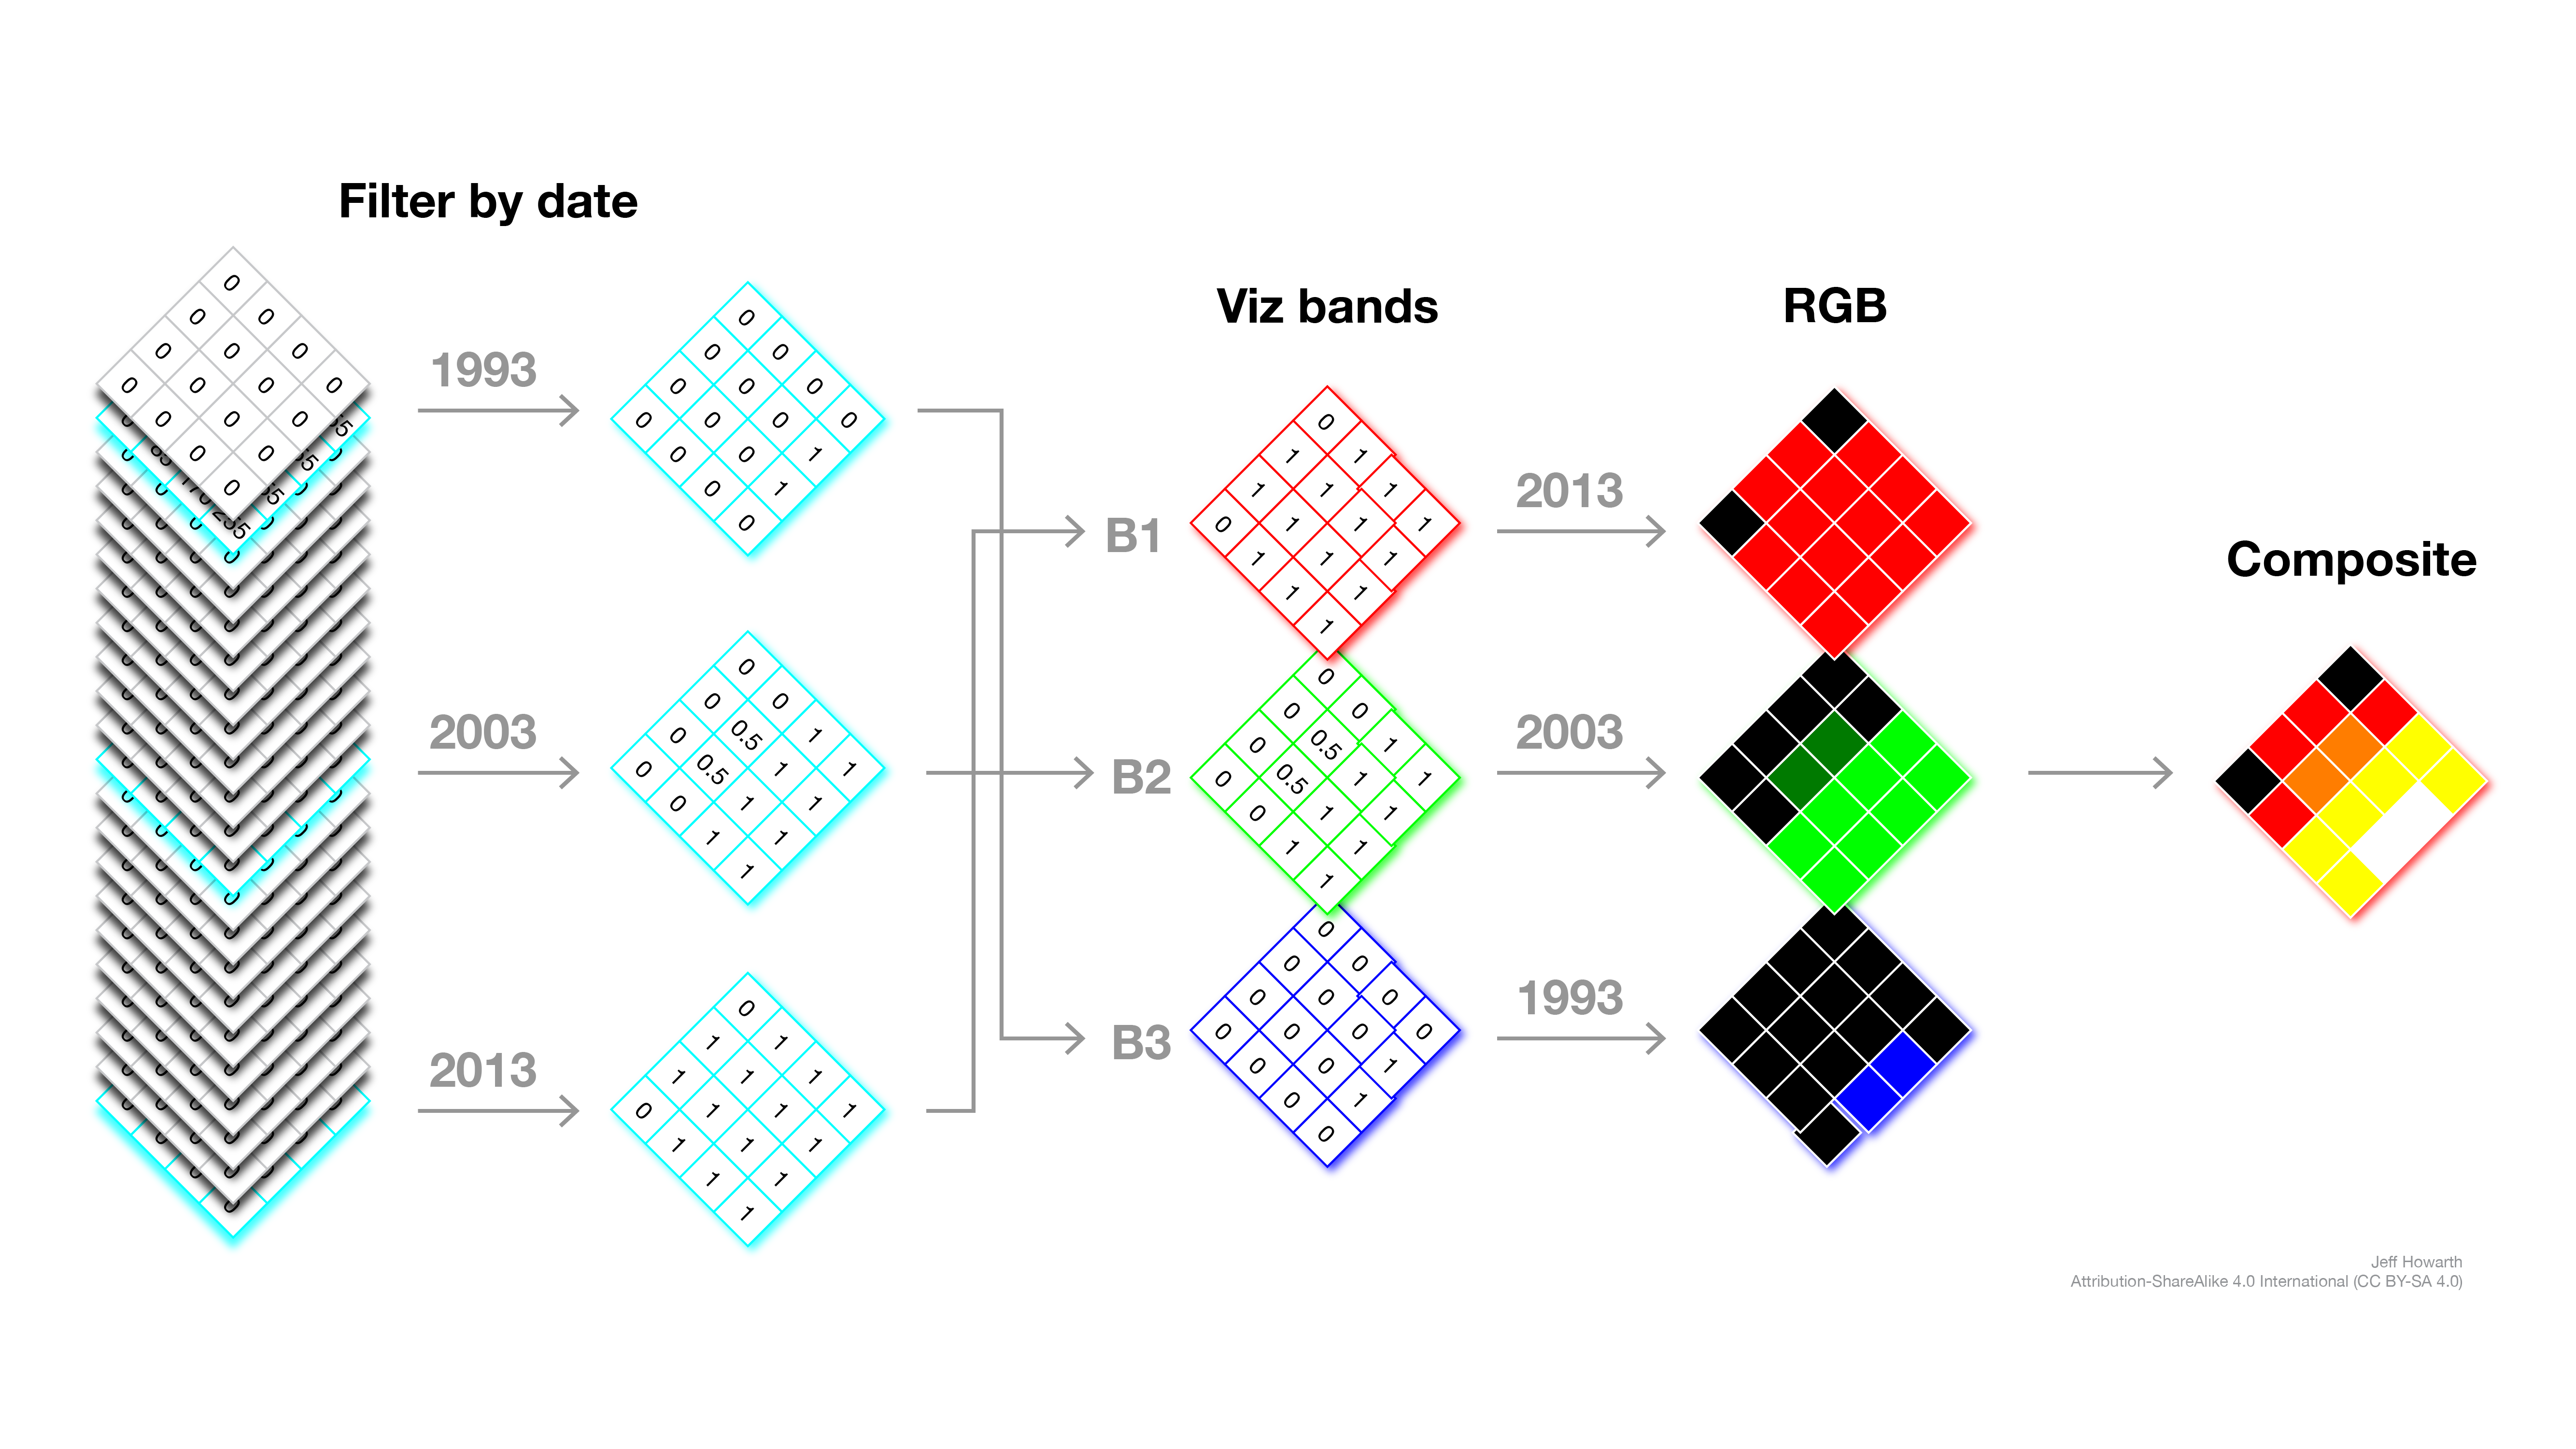
The tutorial also shows you how to compose your script (using a dictionary and a custom function) so that you can easily change the three years used to define the RGB composite. In other words, the purpose of your script is not simply to deliver a map product, but instead to create a flexible tool for exploring and visualizing the nighttime lights dataset with additive color.
Start a new script
// ~~~~~~~~~~~~~~~~~~~~~~~~~~~~~~~~~~~~~~~~~~~~~~~~~~~~~~~~~~~~~~~~~~~~~~~~~~~~~~
//  Name:     changes_in_the_night.js
//  Author:   Jeff Howarth
//  Date:     10/10/2023
//  Purpose:  Introduce additive color, nighttime lights, and patterns of change.
// ~~~~~~~~~~~~~~~~~~~~~~~~~~~~~~~~~~~~~~~~~~~~~~~~~~~~~~~~~~~~~~~~~~~~~~~~~~~~~~~
Load image collection and select a band
graph LR
  arg1(["pathname\n\nSTRING"]) --> method1["ee.ImageCollection()"] ;
  method1 --> method2[".select()"] ;
  arg2(["band name\n\nSTRING"]) --> method2 ;
  method2 --> output>"output\n\nIMAGE COLLECTION"];

  style method1 fill:#ADD8E6,stroke-width:0px
  style method2 fill:#ADD8E6,stroke-width:0px
  style arg1 fill:#DCDCDC,stroke-width:0px
  style arg2 fill:#DCDCDC,stroke-width:0px
  style output fill:#C5E6A1,stroke-width:0px
// -----------------------------------------------------------------------
//  Load image collection and select a band.
// -----------------------------------------------------------------------

// Image Collection pathname: "NOAA/DMSP-OLS/NIGHTTIME_LIGHTS"
// Band: "stable_lights"

var collection
;

print(
  "Collection",
  collection,
  collection.size(),
  collection.first(),
  collection.first().bandNames()
  )
;
Create dictionary for study years
// -----------------------------------------------------------------------
//  Create a dictionary for study years to assign band 1, 2, 3
// -----------------------------------------------------------------------

// Your goal is to display pixel values in each layer with these colors:
//  2013 with red,
//  2003 with green,
//  1992 with blue.

var yrs = {

};
Make image for Band 1
graph LR
  input[/"collection\n\nIMAGE COLLECTION"/] --> method1[".filter()"] ;
  arg1(["study year\n\nDICTIONARY KEY"]) --> method2(["ee.Filter.calendarRange()"]) ;
  arg2(["time unit\n\nSTRING"]) --> method2 ;
  method2 --> method1 ;
  method1 --> method3[".first()"] ;
  method3 --> method4[".rename()"] ;
  method5(["String()\n\nFUNCTION"]) --> method4 ;
  arg1 --> method5 ;
  method4 --> output>"output\n\nIMAGE"] ;

  style input fill:#C5E6A1,stroke-width:0px
  style method1 fill:#ADD8E6,stroke-width:0px
  style method2 fill:#ADD8E6,stroke-width:0px
  style method3 fill:#ADD8E6,stroke-width:0px
  style method4 fill:#ADD8E6,stroke-width:0px
  style method5 fill:#ADD8E6,stroke-width:0px
  style arg1 fill:#DCDCDC,stroke-width:0px
  style arg2 fill:#DCDCDC,stroke-width:0px
  style output fill:#C5E6A1,stroke-width:0px
// -----------------------------------------------------------------------
//  Make an image for band 1
// -----------------------------------------------------------------------

var b1 = collection
;

print(
  "Band 1:",
  b1
  )
;
Display image as a map layer
// -----------------------------------------------------------------------
//  Display image as layer on the map.
// -----------------------------------------------------------------------

Map.setCenter(126.8, 33.485, 5);
Map.setOptions('HYBRID');

var viz ;

Map.addLayer();
Make and display image for Band 2
graph LR
  input[/"collection\n\nIMAGE COLLECTION"/] --> method1[".filter()"] ;
  arg1(["study year\n\nDICTIONARY KEY"]) --> method2(["ee.Filter.calendarRange()"]) ;
  arg2(["time unit\n\nSTRING"]) --> method2 ;
  method2 --> method1 ;
  method1 --> method3[".mean()"] ;
  method3 --> method4[".rename()"] ;
  method5(["String()\n\nFUNCTION"]) --> method4 ;
  arg1 --> method5 ;
  method4 --> output>"output\n\nIMAGE"];

  style input fill:#C5E6A1,stroke-width:0px
  style method1 fill:#ADD8E6,stroke-width:0px
  style method2 fill:#ADD8E6,stroke-width:0px
  style method3 fill:#ADD8E6,stroke-width:0px
  style method4 fill:#ADD8E6,stroke-width:0px
  style method5 fill:#ADD8E6,stroke-width:0px
  style arg1 fill:#DCDCDC,stroke-width:0px
  style arg2 fill:#DCDCDC,stroke-width:0px
  style output fill:#C5E6A1,stroke-width:0px
// -----------------------------------------------------------------------
//  Make and display image for band 2.
// -----------------------------------------------------------------------

var b2
;

print(
  "Band 2:",
  b2
  )
;

Map.addLayer();
Write a function
// -----------------------------------------------------------------------
//  Write a function
// -----------------------------------------------------------------------

var makeImageForBand
  ;

// Call the function

var b1 ;

// Display result as a layer.

// Map.addLayer();
Test generality of function
// -----------------------------------------------------------------------
//  Test generality of function.
// -----------------------------------------------------------------------

// Does .first() and .mean() deliver identical results for b1 case?

var test ;

// Map.addLayer();
Revise script to apply function
// -----------------------------------------------------------------------
//  Revise script to apply function.
// -----------------------------------------------------------------------

// 1. Comment out sections above that made and drew b1 and b2;

// 2. Redefine map options and viz parameters (that were commented out).

Map.setCenter(126.8, 33.485, 5);
Map.setOptions('HYBRID');

var viz = {min:0, max: 63};

// 3. Call function to remake all bands

var b1 ;
var b2 ;
var b3 ;

// 4. Add results as layers to map.

Map.addLayer();
//
Make and display RGB composite image
graph LR
  input[/"Band 1\n\nIMAGE"/] --> method1[".addBands()"] ;
  method1 --> method2[".addBands()"] ;
  arg1(["Band 2\n\nIMAGE"]) --> method1 ;
  arg2(["Band 3\n\nIMAGE"]) --> method2 ;
  method2 --> output>"output\n\nIMAGE"];

  style input fill:#C5E6A1,stroke-width:0px
  style method1 fill:#ADD8E6,stroke-width:0px
  style method2 fill:#ADD8E6,stroke-width:0px
  style arg1 fill:#C5E6A1,stroke-width:0px
  style arg2 fill:#C5E6A1,stroke-width:0px
  style output fill:#C5E6A1,stroke-width:0px
// -----------------------------------------------------------------------
//  Construct and display three band image from the three images.
// -----------------------------------------------------------------------

// Create image.

var change_image
;

print(
  "Change Image",
  change_image
  )
;

// Display result as a map layer.

Map.addLayer();

This work is licensed under a Creative Commons Attribution-NonCommercial-NoDerivs 4.0 International License.